
 CA
 NZ
 UK
 US
 IND

 AU

 Share
 X (Formerly Twitter)
 Whatsapp
 Facebook
 LinkedIn
 Telegram
 Email This Article
 Copy Link
 Summarize with AI
 Chat GPT
 Perplexity

Image source: © 2025 Krish Capital Pty. Ltd.
Highlights
- LFS recorded AUD 8.2 billion in lending volumes in FY24, up 13% YoY and a five-year high.
- LFS to continue investing in product innovation, digital platforms, and strategic partnerships.
- LFS targets customer base expansion, leveraging its “Path to Full Potential” strategy for sustained growth.
Latitude Group Holdings Limited (ASX:LFS) is a consumer finance provider with operations in Australia and New Zealand across sales finance, personal lending, and payments through its A&NZ Pay, A&NZ Money, and other segments.
In the financial year ended December 2024 (FY24), LFS reported a 13% YoY increase in total purchase and lending volumes across its Pay and Money Divisions to AUD 8.2 billion, contributing to an 8% rise in receivables to AUD 6.7 billion, the highest since H1FY20.
The Money division achieved record new loan originations of AUD 1.5 billion, recording a 33% annual increase. Meanwhile, the company recorded a statutory NPAT from continuing operations of AUD 31 million, reversing a loss of AUD 103 million in FY23.
Company Outlook
LFS has shared an optimistic FY25 outlook, supported by stable macroeconomic conditions and a potential easing of interest rates that should improve net interest margins. Resilient labour markets, lending demand and rising consumption are anticipated to sustain profit growth. Additional margin gains are expected from refinancing activities, prior pricing actions and rate cuts.
LFS plans to continue investing in product innovation, digital expansion, and strategic partnerships as part of its "Path to Full Potential" strategy. The company also aims to expand into new customer segments and sectors to build on the progress achieved in 2024.
Share performance of LFS
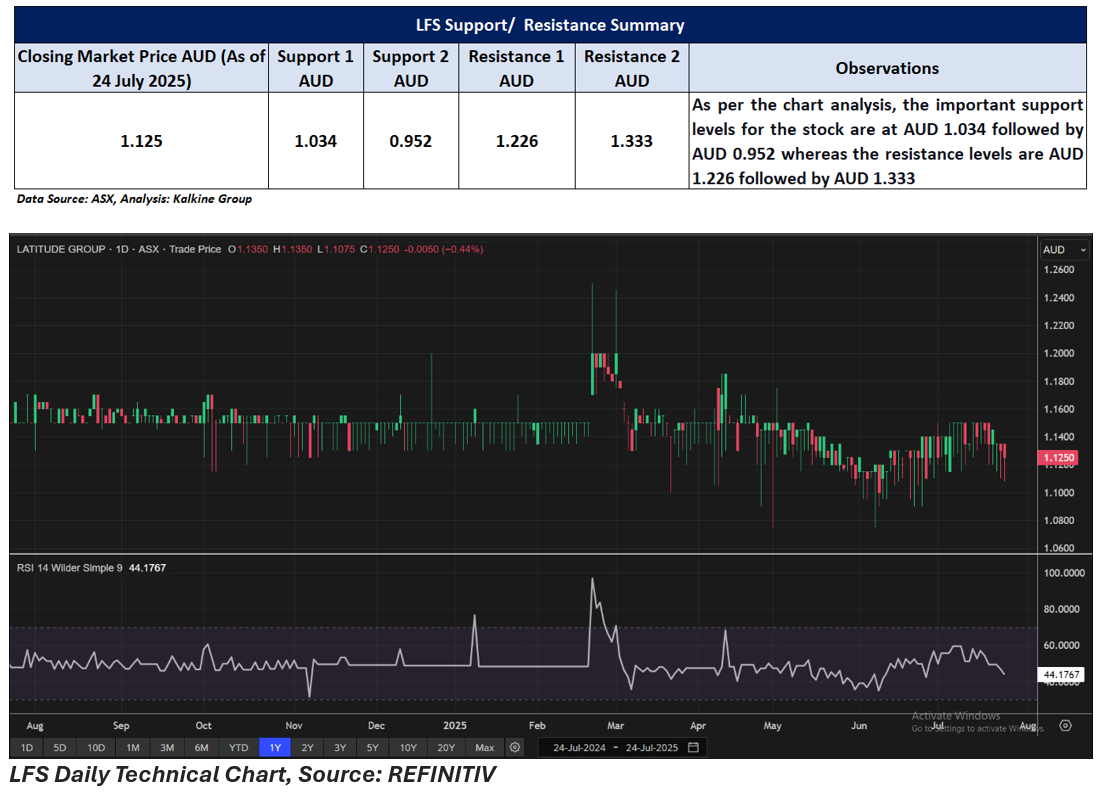
LFS shares closed 0.44% lower at AUD 1.125 on 24 July 2025. LFS’ share price has declined 2.17% over the past year, with a 3-month loss of 1.32% and a 6-month decline of 2.17%.
The 52-week high for Latitude is AUD 1.250, hit on 21 February 2025, and the 52-week low is AUD 1.075, recorded on 6 June 2025.
Support and Resistance Summary
Note 1: Past performance is neither an Indicator nor a guarantee of future performance.
Note 2: The reference date for all price data, and currency, is 24 July 2025. The reference data in this report has been partly sourced from EODHD/Others.
Technical Indicators Defined:
Support: A level at which the stock prices tend to find support if they are falling, and a downtrend may take a pause backed by demand or buying interest. Support 1 refers to the nearby support level for the stock and if the price breaches the level, then Support 2 may act as the crucial support level for the stock.
Resistance: A level at which the stock prices tend to find resistance when they are rising, and an uptrend may take a pause due to profit booking or selling interest. Resistance 1 refers to the nearby resistance level for the stock and if the price surpasses the level, then Resistance 2 may act as the crucial resistance level for the stock.


 Nov 12, 2026





 Please wait processing your request...