
 CA
 NZ
 UK
 US
 IND

 AU

 Share
 X (Formerly Twitter)
 Whatsapp
 Facebook
 LinkedIn
 Telegram
 Email This Article
 Copy Link
 Summarize with AI
 Chat GPT
 Perplexity

Highlights
- JIN’s FY25 revenue decreased 8.8% to AUD 145.3 million due to lower Lottery Retailing jackpots.
- FY26 Lottery Retailing total transaction value rose 5.2%, with revenue and margins improving.
- Director Mike Veverka received 8,547 performance rights and 220,520 options, approved at the AGM.
Jumbo Interactive Limited (ASX:JIN) is an ASX-listed company that provides digital lottery software and management solutions to charity and government organisations. Established in 1995, it operates in Australasia, the UK, and Canada, employing over 250 staff.
Financial Performance
For the financial year 2025 (FY25), JIN reported revenue of AUD 145.3 million, down 8.8% YoY from AUD 159.3 million in FY24, primarily due to lower jackpots in Lottery Retailing, partially offset by improved marketing, portfolio mix, and higher Daily Winners engagement. EBITDA declined 8.6% YoY to AUD 68.7 million in FY25 from AUD 75.1 million in FY24, with margin management helping to support earnings despite lower revenue. SaaS TTV exceeded AUD 250 million, and Managed Services in the UK and Canada grew modestly. In FY25, cash at bank increased to AUD 79.9 million, up by 15.8% from AUD 69.0 million in the previous year.
Business Update
On 17 November 2025, the company released a director interest update, noting that Director Mike Veverka received 8,547 performance rights and 220,520 options under the company’s remuneration framework. No disposals occurred, and the changes were approved at the 11 November 2025 AGM.
On 11 November 2025, the company released a trading update for the first four months of FY26. Lottery Retailing total transaction value (TTV) rose 5.2% YoY to AUD 142.4 million despite modest jackpots, with revenue increasing by 12.5% and margins improving from non-TLC products. SaaS TTV and revenue grew by 9.0% and 8.1%, respectively, while Managed Services recorded double-digit growth in the UK and Canada, supported by new business wins and pricing initiatives.
Key Positives and Negatives
For FY25, the company reported an EBITDA margin of 47.9%, compared with 46.8% in FY24. The company’s quick ratio increased to 2.37x in FY25 from 1.90x over the same period. Return on equity declined to 33.9% in FY25 compared with 40.3% in FY24, while the debt-to-equity ratio rose to 0.12x in FY25 from 0.03x in FY24.
Business Outlook
For FY26, JIN expects its Australia EBITDA margin to range between 46% and 50%, supported by growth in Lottery Retailing, SaaS, and Managed Services through jackpot frequency, higher product momentum, and operational efficiencies.
Contributions from recent acquisitions are projected to support overall performance, with DCG UK adding GBP 7.0–7.3 million over about eight and a half months, and DG USA contributing USD 2.7–3.0 million over eight months. The company plans a fully franked dividend payout ratio of 30%–50% of statutory group NPAT, reflecting capital management following acquisitions and higher debt.
Share Performance of JIN
JIN’s shares were trading at AUD 10.62 per share on 27 November 2025, with an intraday loss of 0.19%. JIN’s stock has declined by 13.09% in the last three months but up by 5.04% over the six months and decreased by 24.84% over the past year. JIN’s 52-week high is AUD 14.430, recorded on 05 December 2024, and the 52-week low is AUD 9.380, recorded on 03 June 2025.
Support and Resistance Summary
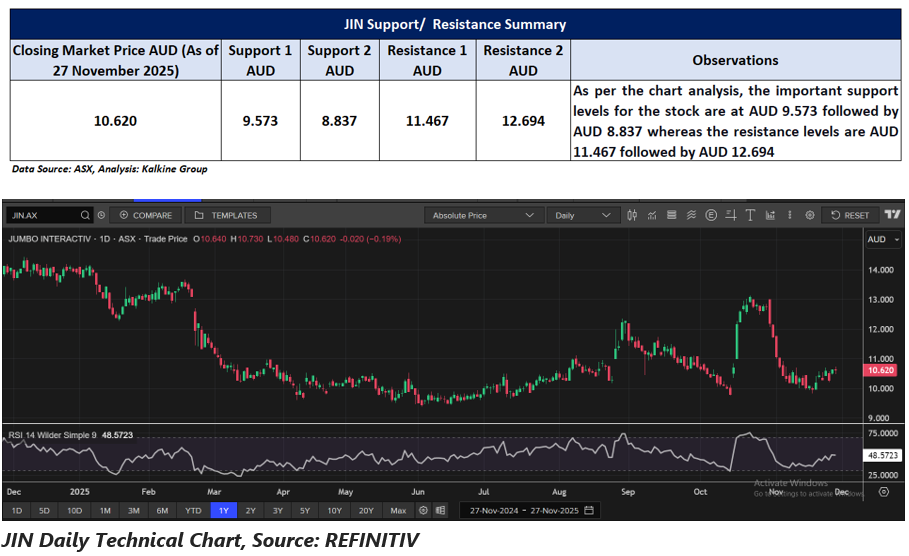 Note 1: Past performance is neither an Indicator nor a guarantee of future performance.
Note 2: The reference date for all price data, and currency, is 27 November 2025. The reference data in this report has been partly sourced from EODHD/Others.
Technical Indicators Defined:
Support: A level at which the stock prices tend to find support if they are falling, and a downtrend may take a pause backed by demand or buying interest. Support 1 refers to the nearby support level for the stock and if the price breaches the level, then Support 2 may act as the crucial support level for the stock.
Resistance: A level at which the stock prices tend to find resistance when they are rising, and an uptrend may take a pause due to profit booking or selling interest. Resistance 1 refers to the nearby resistance level for the stock and if the price surpasses the level, then Resistance 2 may act as the crucial resistance level for the stock.


 Nov 12, 2026





 Please wait processing your request...