
 CA
 NZ
 UK
 US
 IND

 AU

 Share
 X (Formerly Twitter)
 Whatsapp
 Facebook
 LinkedIn
 Telegram
 Email This Article
 Copy Link
 Summarize with AI
 Chat GPT
 Perplexity

Key Highlights
- Integral Diagnostics continues to strengthen its long-term outlook through its leading position as one of Australasia's largest providers of diagnostic imaging services.
- The company remains well positioned to benefit from growing demand for medical imaging, an ageing population, and ongoing investment in advanced diagnostic technologies.
- Technically, IDX is testing the neckline resistance of a potential Inverse Head & Shoulders pattern near $2.17, with a decisive breakout required to confirm the bullish reversal.
- Based on the measured-move projection, a confirmed breakout above $2.17 would generate a medium-term upside target near $2.43.
After enduring a prolonged downtrend throughout the past year, Integral Diagnostics Limited (ASX: IDX) appears to be approaching an important technical turning point. The stock has developed a potential Inverse Head & Shoulders pattern while recovering towards a descending trendline that has capped rallies since May 2026. Supported by improving buying momentum, investors will now be watching closely for a decisive breakout above the neckline resistance, which could mark the beginning of a new medium-term recovery trend.
The Healthcare Growth Story
Integral Diagnostics is one of Australasia's leading diagnostic imaging providers, operating an extensive network of radiology clinics across Australia and New Zealand.
- Growing Demand for Diagnostic Imaging: Australia's ageing population and increasing prevalence of chronic diseases continue to support long-term demand for diagnostic imaging services, including MRI, CT, ultrasound and PET scans.
- Expanding Healthcare Network: Through acquisitions and strategic investments, IDX has built a diversified portfolio of imaging centres, strengthening its market presence and improving operational scale.
- Technology and Service Enhancement: Continued investment in advanced imaging equipment and digital healthcare solutions supports improved diagnostic capabilities, patient outcomes and operational efficiency.
- Defensive Healthcare Exposure: As a provider of essential healthcare services, Integral Diagnostics benefits from relatively resilient demand regardless of broader economic conditions.
Associated Risks
Despite the improving technical structure, several risks remain.
The potential Inverse Head & Shoulders pattern remains unconfirmed, meaning IDX must produce a convincing breakout above the neckline resistance near $2.17 before the bullish reversal can be validated. Failure to overcome this resistance could result in another period of consolidation or a pullback towards the right shoulder.
In addition, the company's earnings remain sensitive to regulatory changes, government healthcare funding, reimbursement policies, labour shortages and operating cost inflation. Any deterioration in these factors could weigh on future profitability.
Furthermore, although momentum has improved, sustained buying interest and stronger trading volume will be required to confirm that institutional investors are supporting the emerging recovery.
Technical Outlook
IDX's daily chart is approaching an important technical inflection point as a potential Inverse Head & Shoulders pattern nears confirmation.
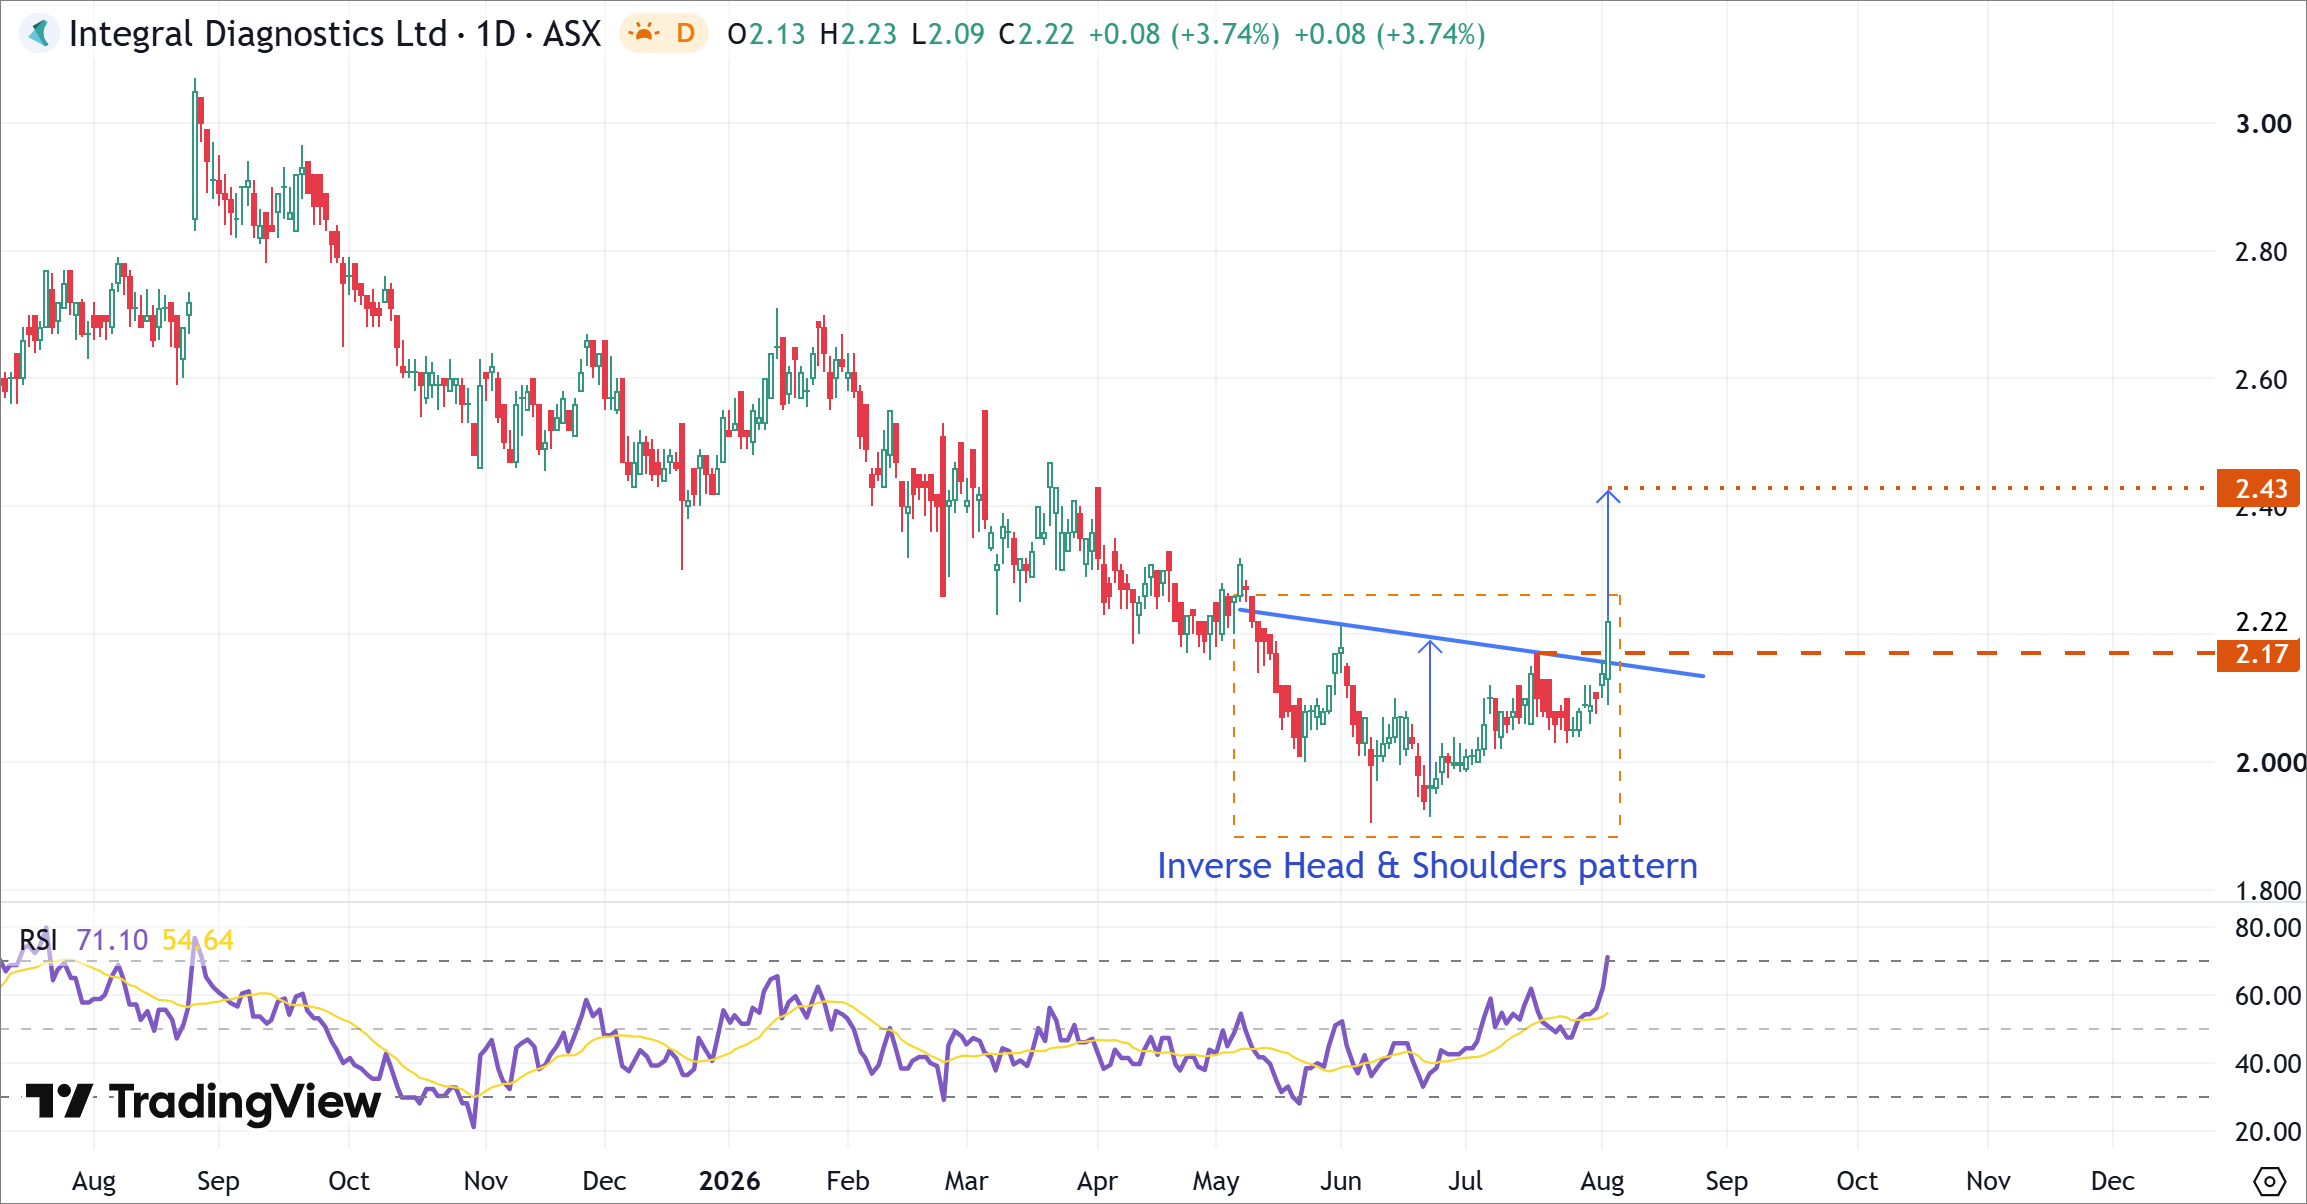 IDX's Daily Price Chart (at the closing price of 03/08/2026). Powered by: tradingview.com.
- IDX has formed a potential Inverse Head & Shoulders pattern following several months of base building after its prolonged decline, suggesting that bearish momentum may be gradually fading.
- The neckline resistance is located near $2.17 and also aligns closely with the descending trendline from the May 2026 high. A sustained close above this level would confirm the bullish reversal and significantly strengthen the medium-term outlook.
- Applying the traditional measured-move projection from the Inverse Head & Shoulders formation generates an upside objective near $2.43, representing the next major technical resistance following a confirmed breakout.
Bottom Line
Integral Diagnostics Limited (ASX: IDX) appears to be approaching a significant technical turning point after establishing a potential base following its extended correction. The development of a potential Inverse Head & Shoulders pattern suggests selling pressure is fading, although confirmation is still required before a durable trend reversal can be established.
A decisive breakout above $2.17 would confirm the bullish pattern and initially open the way towards the measured objective near $2.43. Until then, the neckline remains the most important technical level to monitor, as a successful breakout would substantially strengthen IDX's medium-term recovery outlook.


 Nov 12, 2026





 Please wait processing your request...