
 CA
 NZ
 UK
 US
 IND

 AU

 Share
 X (Formerly Twitter)
 Whatsapp
 Facebook
 LinkedIn
 Telegram
 Email This Article
 Copy Link
 Summarize with AI
 Chat GPT
 Perplexity

Highlights
- FY25 results supported by merger synergies, higher patient volumes, and margin improvement.
- In FY25, the company reported 33.7% revenue increase and 74.4% NPAT growth.
- FY25 performance shows margin expansion and higher operating cash flow generation.
Integral Diagnostics Limited (ASX:IDX) is an Australia-based provider of medical imaging services, operating across Australia and New Zealand. The company manages several well-known brands in four Australian states, including Lake Imaging and the X-Ray Group in Victoria and New South Wales, South Coast Radiology, Peloton Radiology, and Imaging Queensland in Queensland, and Apex Radiology in Western Australia.
Financial Update
In the financial year 2025 (FY25), the company recorded revenue of AUD 628.0 million, reflecting a 33.7% YoY increase from AUD 469.7 million in FY24, supported by higher patient volumes, Medicare indexation, and a favourable service mix. Operating EBITDA rose 38.3% YoY to AUD 126.5 million in FY25 from AUD 91.5 million in FY24 and in the same year the margin improved to 20.1% from 19.5% in FY24, aided by merger synergies amounting to AUD 7.0 million. Operating free cash flow increased 42.9% YoY to AUD 80.0 million in FY25, compared to AUD 56 million in FY24. During the same period operating NPAT grew 74.4% YoY to AUD 31.6 million during the period.
Business Update
On 21 October 2025, IDX has announced that 876,068 fully paid ordinary shares currently held under voluntary escrow will be released on 1 November 2025, in accordance with ASX Listing Rule 3.10A.
Key Positives and Negatives
In FY25, the company has reported an EBITDA margin of 18.3% well above the industry median of 6%, and in the same period improved return on equity of 0.9% compared to -18% in FY24. However, the quick ratio declined to 0.66x in FY25 from 0.85x in FY24, and the asset turnover ratio dropped to 0.58x in FY25, below the industry median of 1.19x.
Business Outlook
IDX plans to drive growth through organic expansion, improved radiologist productivity, wider use of teleradiology, and digital, AI, and ESG initiatives. The company expects continued revenue and EBITDA margin growth in FY26, supported by around AUD 14 million in synergies, new clinic expansions, and operational efficiencies, with capex projected at AUD 45–55 million. The diagnostic imaging sector is set for sustained growth, supported by rising healthcare demand, MRI deregulation, and the National Lung Cancer Screening Program, positioning IDX to benefit from these industry tailwinds.
Share Performance
IDX’ shares were trading at AUD 2.56 per share on 28 October 2025 with intraday loss
of 1.54%. RMS’ stock down by 5.88% over the past three months, but up by 8.01% over the past six months, however 17.94% over the past year. IDX’s 52 week high is AUD 3.18, recorded on 05 December 2024 and 52-week low is AUD 1.910, recorded on 26 February 2025.
Support and Resistance Summary
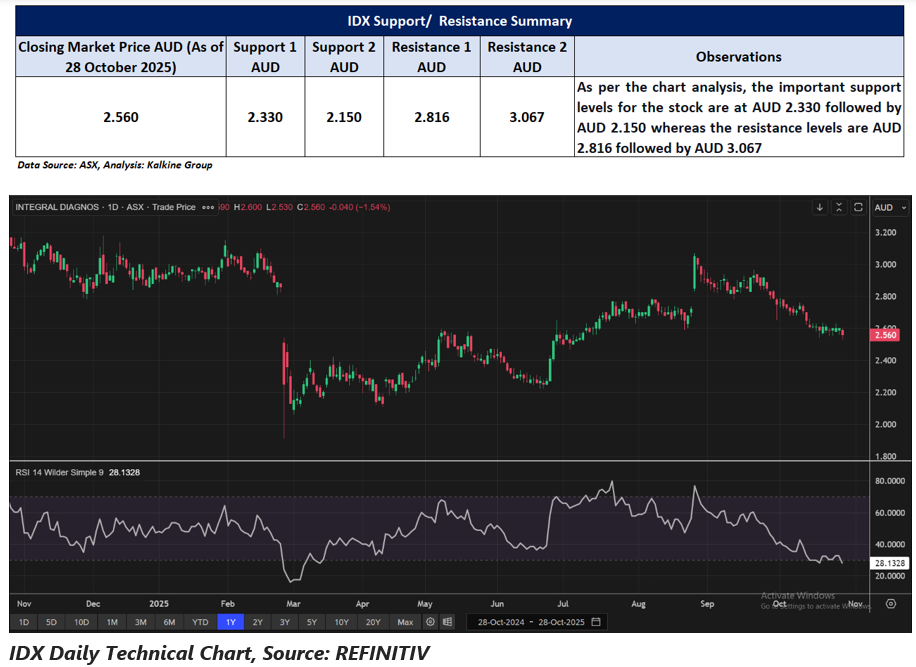
Note 1: Past performance is neither an Indicator nor a guarantee of future performance.
Note 2: The reference date for all price data, and currency, is 28 October 2025. The reference data in this report has been partly sourced from EODHD/Others.
Technical Indicators Defined:
Support: A level at which the stock prices tend to find support if they are falling, and a downtrend may take a pause backed by demand or buying interest. Support 1 refers to the nearby support level for the stock and if the price breaches the level, then Support 2 may act as the crucial support level for the stock.
Resistance: A level at which the stock prices tend to find resistance when they are rising, and an uptrend may take a pause due to profit booking or selling interest. Resistance 1 refers to the nearby resistance level for the stock and if the price surpasses the level, then Resistance 2 may act as the crucial resistance level for the stock.


 Nov 12, 2026





 Please wait processing your request...