
 CA
 NZ
 UK
 US
 IND

 AU

 Share
 X (Formerly Twitter)
 Whatsapp
 Facebook
 LinkedIn
 Telegram
 Email This Article
 Copy Link
 Summarize with AI
 Chat GPT
 Perplexity

Key Highlights
- ING is developing a potential Inverse Head and Shoulders pattern, indicating that its prolonged correction may be approaching exhaustion.
- The stock has recently broken above a long-term descending trendline that has capped prices since mid-2025, providing an early indication that bearish momentum is fading.
- The neckline of the pattern is located near $2.15 and represents the key resistance level that must be overcome to confirm the bullish reversal.
- A confirmed breakout above the neckline could generate an initial upside target near $2.41.
- The bullish reversal remains unconfirmed until the stock completes the pattern and decisively breaks above neckline resistance.
Inghams Group Limited (ASX: ING) is showing encouraging signs of stabilisation after spending much of the past year under selling pressure. Following a prolonged downtrend that began after the stock peaked near $3.80 in 2025, ING has started to build a constructive base and recently broke above a major descending trendline.
While the emerging Inverse Head and Shoulders pattern remains incomplete, the improving price action suggests that buyers are gradually regaining control. A decisive breakout above the neckline resistance near $2.15 would provide important confirmation that a broader recovery is underway.
Stable Industry Position and Defensive Earnings Profile
Inghams remains one of the largest poultry producers across Australia and New Zealand, supplying fresh and processed chicken products to supermarkets, food-service operators, and export markets. The company's vertically integrated business model provides operational scale and helps support earnings resilience through varying market conditions.
In addition, ongoing population growth, steady consumer demand for affordable protein products, and operational efficiency initiatives continue to provide support for the company's long-term outlook. These factors offer a constructive fundamental backdrop as the stock attempts to transition from correction to recovery.
Associated Risks
Despite the improving technical picture, the bullish reversal remains unconfirmed. Failure to break above the neckline resistance near $2.15 could result in another period of consolidation or a retest of lower support levels.
In addition, Inghams remains exposed to risks associated with feed costs, labour expenses, disease outbreaks, changing consumer demand, and competitive pressures within the food production industry. Broader economic uncertainty may also affect investor sentiment towards the sector.
Technical Outlook
ING's daily chart is displaying a constructive technical setup that suggests a potential transition from downtrend to recovery.
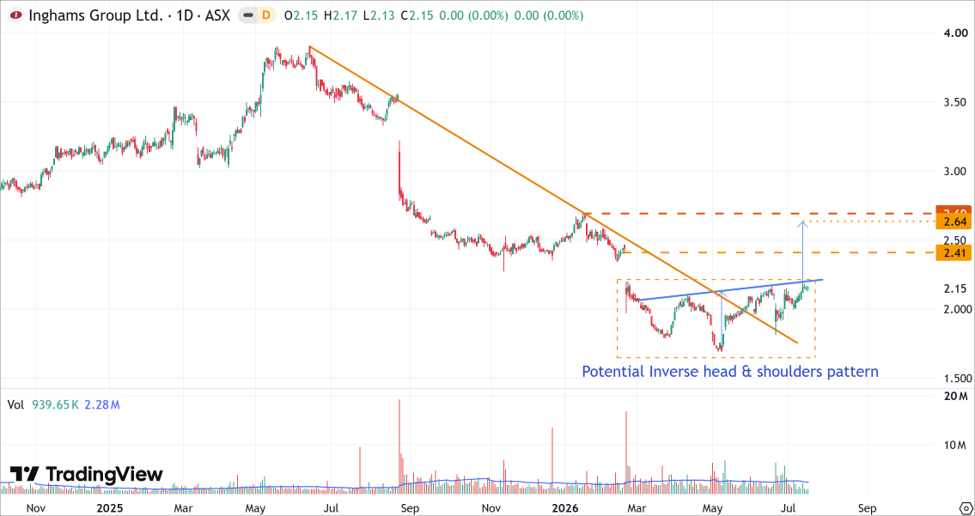
ING's Daily Price Chart (at the closing price of 16/07/2026). Powered by: tradingview.com
- On the daily chart, ING is developing a potential Inverse Head and Shoulders pattern following an extended decline from its 2025 highs, indicating that buyers have begun to defend the support region near recent lows.
- The neckline of the pattern is located near $2.15 and represents the key resistance level that must be overcome to confirm the bullish reversal.
- Encouragingly, the stock has already broken above a major descending trendline that has defined the broader downtrend since mid-2025. This trendline breakout provides additional evidence that momentum is beginning to shift in favour of buyers.
- Applying the traditional measured-move projection from the Inverse Head and Shoulders pattern generates an initial upside target near $2.64, while some pullbacks might appear near significant resistance at $2.41.
Bottom Line
Inghams Group Limited (ASX: ING) appears to be building an important base following an extended correction from its 2025 highs. The development of a potential Inverse Head and Shoulders pattern, together with the breakout above long-term trendline resistance, suggests that selling pressure may be fading and that investor sentiment is gradually improving.
However, the bullish reversal remains unconfirmed. A decisive breakout above the $2.15 neckline is required to complete the pattern and strengthen the recovery outlook. If achieved, the stock could initially target $2.41, with scope for a move towards $2.64 over the medium term. As a result, the neckline area remains the key technical level for investors to monitor in the weeks ahead.


 Nov 12, 2026





 Please wait processing your request...