
 CA
 NZ
 UK
 US
 IND

 AU

 Share
 X (Formerly Twitter)
 Whatsapp
 Facebook
 LinkedIn
 Telegram
 Email This Article
 Copy Link
 Summarize with AI
 Chat GPT
 Perplexity

For beginner investors, understanding how to read and interpret financial statements is one of the most valuable skills to develop. While a full tutorial on financial analysis is beyond the scope of this article, the following framework provides a starting point for evaluating the stocks discussed here.
Revenue Growth
Revenue growth, sometimes called top-line growth, measures how fast a company's sales are increasing. Among the 52-week-high stocks, the growth profiles vary enormously. Few companies that touched 52-week high on 25 March 2026, 4DMedical (ASX:4DX) reported half-year revenue of just A$2.85 million, Elsight (ASX:ELS) was targeting over A$30 million for the full year, and APA Group (ASX:APA) generates billions in annual revenue from its pipeline network.
The key question is not just how fast revenue is growing, but whether the growth is sustainable and profitable. A company can grow revenue rapidly by selling products below cost or by acquiring other businesses, but neither approach creates lasting value unless the underlying economics are sound.
Profitability Metrics
The most commonly used profitability metrics are gross margin, operating margin, and net margin. Gross margin measures the percentage of revenue remaining after subtracting the direct cost of goods sold. Operating margin accounts for overhead costs like salaries, rent, and research and development. Net margin reflects the bottom line after all costs, including interest and taxes.
Among the featured stocks, APA Group and Endeavour Group are established profitable businesses with positive margins. 4DMedical and Elsight are in earlier stages where profitability has not yet been consistently achieved. Micro-cap names like Nuenergy Gas and White Cliff Minerals may not have meaningful revenue at all, making margin analysis inapplicable.
Balance Sheet Strength
A company's balance sheet shows what it owns (assets), what it owes (liabilities), and the residual value attributable to shareholders (equity). Key metrics include the debt-to-equity ratio, current ratio, and cash position.
For growth-stage companies like 4DMedical, the most important balance sheet metric is cash runway: how many months of operations can the company fund before it needs to raise additional capital? A company that is burning A$20 million per quarter with A$50 million in cash has approximately 2.5 quarters of runway, after which it will need to issue new shares, take on debt, or generate sufficient revenue to cover costs.
For established companies like APA Group, the focus shifts to leverage ratios and interest coverage. Infrastructure companies typically carry significant debt because their stable, contracted cash flows can support it. However, too much debt can become problematic if interest rates rise or if revenue declines unexpectedly.
Cash Flow Analysis
Cash flow from operations is often a more reliable indicator of financial health than reported earnings, because it is harder to manipulate through accounting choices. A company that reports positive earnings but negative operating cash flow may be relying on accruals, receivables management, or other non-cash items to flatter its income statement.
For resource companies and explorers like Amplitude Energy or Blackstone Minerals, cash flow analysis is particularly important because exploration spending is typically classified as investing cash flow. A company can report improving operating cash flow while still burning through cash on exploration programmes that may or may not yield results.
Valuation Framework
Valuation is the process of determining what a stock is worth relative to its current price. There is no single correct way to value a stock, but several commonly used frameworks can help investors make more informed decisions.
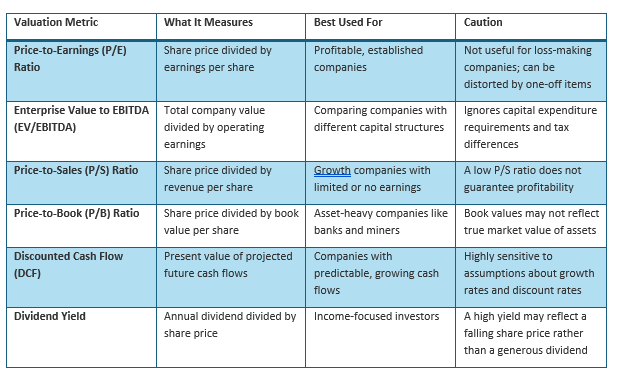
For the stocks in this article, no single metric captures the full picture. 4DMedical and Elsight, as high-growth but pre-profitability companies, are best evaluated using revenue multiples and discounted cash flow models with scenario analysis. APA Group and Insignia Financial, as established businesses, can be meaningfully assessed using P/E and EV/EBITDA ratios. Micro-cap explorers like White Cliff Minerals defy traditional valuation methods entirely and are more appropriately assessed using risk-adjusted option pricing models or net asset value calculations based on resource estimates.


 Nov 12, 2026





 Please wait processing your request...