
 CA
 NZ
 UK
 US
 IND

 AU

 Share
 X (Formerly Twitter)
 Whatsapp
 Facebook
 LinkedIn
 Telegram
 Email This Article
 Copy Link
 Summarize with AI
 Chat GPT
 Perplexity

Key Highlights
- A trailing dividend yield of 11.4% remains a primary draw for income-focused investors.
- Management has moved to a defensive posture, overweighting consumer staples and utilities while underweighting tech.
- Maintained an industry-leading net operating margin of 77.0% for the 2025 financial year.
- Despite fund outflow pressures, strong investment performance added US$14.8 billion to the asset base in 2025.
The narrative for GQG Partners (ASX:GQG) has reached a critical inflection point in early 2026. After a prolonged period where deep value and an outsized yield failed to spark momentum, the daily chart has staged a structural breakout. This price action finally provides the technical confirmation that aligns with the firm’s resilient fundamental performance.
High-Margin Value and Cash Generation
- GQG continues to operate as a high-margin cash machine, with 2025 results highlighting significant operating leverage as net revenue climbed 6.3% to US$808.3 million, primarily driven by a 10.8% increase in average FUM.
- Net income attributable to the company rose 7.3% to US$463.3 million, supporting the board's declaration of a 4Q25 dividend of US$0.0365 (approx. AU$0.051), which maintains a consistent 90% payout ratio of distributable earnings.
- Currently trading at a P/E ratio of approximately 8.3x, the stock remains markedly cheaper than the broader Australian financial sector while offering a substantial yield.
Associated Risks
- While the numbers are robust, investors must weigh the persistent headwind of fund outflows, as January 2026 saw net outflows of US$4.2 billion across all strategies following US$3.9 billion in outflows during 2025.
- The firm’s defensive positioning has also led to relative underperformance compared to tech-heavy benchmarks during recent market surges, and bears have flagged the 11% yield as potentially stretched if net profitability softens given the high 90% payout ratio.
- Furthermore, future FUM growth remains heavily dependent on continued positive market performance to offset these client withdrawals.
Technical Outlook
The technical setup has transitioned from a bearish distribution phase into a clear accumulation breakout.
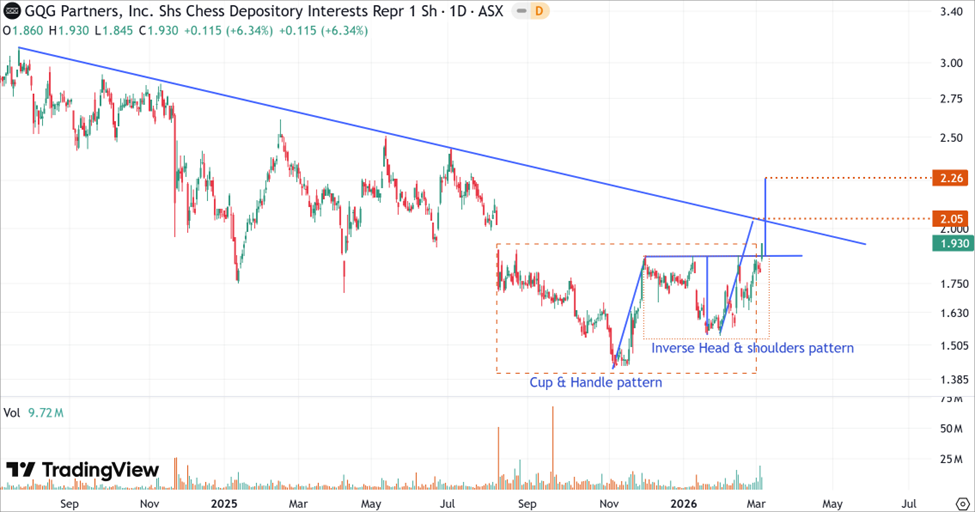
GQG’s Daily Price Chart (at the closing price of 05th March 2026). Powered by: tradingview.com
- On the daily chart, GQG’s stock price broke above both inverse head and shoulders and cup and handle patterns, indicating a trend reversal signal from downward to upward.
- The target of the cup and handle pattern is placed near the long-term downward trendline started in July 2024 at $2.05, anticipating that potential selling pressure might emerge there.
- If the price is able to break out of this level decisively, the next price target can be seen at $2.26, which is the inverse head and shoulders pattern’s projected target.
Bottom Line
GQG Partners has finally bridged the gap between its defensive fundamentals and its market price. The technical breakout at $1.875 validates the long-held thesis of value investors. With a double-digit yield and a clear structural shift, the upcoming FUM report on March 11, 2026, will be the next litmus test for this newfound momentum.


 Nov 12, 2026





 Please wait processing your request...