
 CA
 NZ
 UK
 US
 IND

 AU

 Share
 X (Formerly Twitter)
 Whatsapp
 Facebook
 LinkedIn
 Telegram
 Email This Article
 Copy Link
 Summarize with AI
 Chat GPT
 Perplexity

Image source: © 2025 Krish Capital Pty. Ltd.
Highlights
- GQG Partners reported double-digit growth in revenue, operating income, and net income in 1HFY25.
- The company achieved USD 4.9 billion in net inflows year-to-date despite monthly outflows in August.
- GQG continues its global expansion strategy, introducing new investment products and enhancing its presence in Asia-Pacific and Europe.
GQG Partners Inc. (ASX:GQG) is a U.S.-headquartered global investment boutique specialising in actively managed equity portfolios. The firm has established an international client base, including many leading institutions and wholesale platforms.
Half-Year Financial Results
For the half-year ended 30 June 2025 (1HFY25), GQG reported net revenue of USD 403.0 million, representing an 11.0% increase compared to USD 363.1 million in the same period last year. Net operating income rose 12.3% YoY to USD 306.8 million, while net income attributable to GQG increased 14.4% yoy to USD 230.2 million in 1HFY25.
The revenue uplift was primarily driven by higher average funds under management (FUM). This was partly offset by a lower average fee rate, reflecting changes in strategy mix. Performance fees fell due to a drop in relative returns, while non-operating income improved slightly, aided by foreign exchange revaluation gains. Core fee income, however, remained higher compared to the prior year.
Funds Under Management Update
As of 31 August 2025, the company reported total FUM of USD 167.6 billion, up from USD 166.6 billion in the previous month. Despite a monthly net outflow of USD 1.8 billion, the company recorded year-to-date net inflows of USD 4.9 billion. The U.S. Equity strategy experienced the largest outflows at USD 1.4 billion.
Outlook and Strategic Direction
Looking ahead, GQG expects to continue expanding assets under management by maintaining its focus on active, concentrated portfolios that support sustainable long-term growth in net revenue and income, even in volatile markets.
The firm is broadening its reach across institutional, sub-advisory, and retail channels, while developing new investment products, including ETFs and UCITS, to engage a wider investor base. Alongside this, GQG is actively building its presence in the Asia-Pacific and European markets, aiming to diversify both assets and revenue.
Share performance of GQG
GQG shares closed at AUD 1.695 per share on 15 September 2025, edging up 0.59% intraday. In one year, the stock has declined 32.47%. It is down 20.05% over six months, 18.90% over three months, and 5.04% in the past month. The weekly performance also shows a 4.24% fall. The stock has fallen 18.12% year-to-date. GQG reached a 52-week high of AUD 2.915 on 26 September 2024 and touched a 52-week low of AUD 1.655 on 11 September 2025.
Support and Resistance Summary
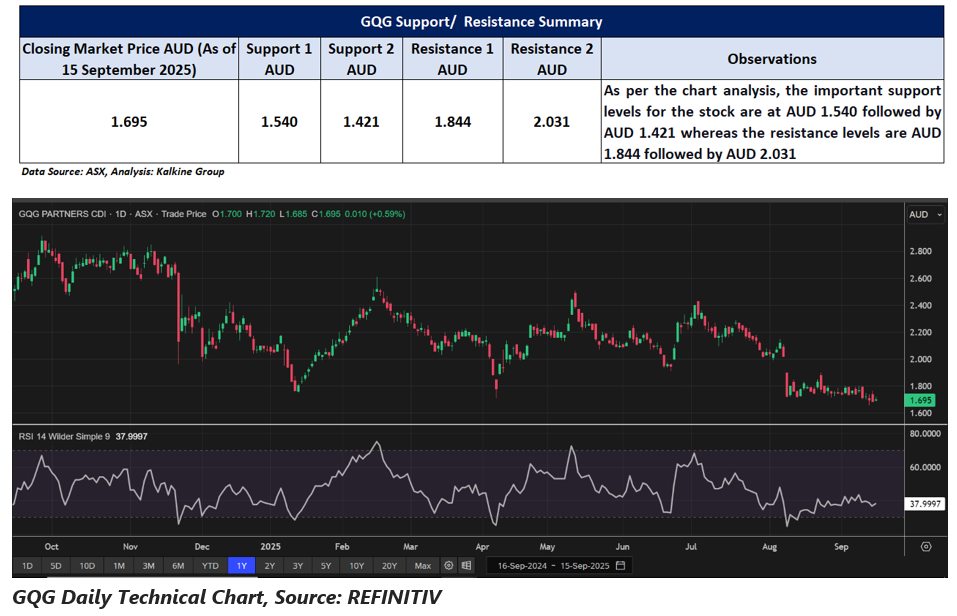
Note 1: Past performance is neither an Indicator nor a guarantee of future performance.
Note 2: The reference date for all price data, and currency, is 15 September 2025. The reference data in this report has been partly sourced from EODHD/Others.
Technical Indicators Defined:
Support: A level at which the stock prices tend to find support if they are falling, and a downtrend may take a pause backed by demand or buying interest. Support 1 refers to the nearby support level for the stock and if the price breaches the level, then Support 2 may act as the crucial support level for the stock.
Resistance: A level at which the stock prices tend to find resistance when they are rising, and an uptrend may take a pause due to profit booking or selling interest. Resistance 1 refers to the nearby resistance level for the stock and if the price surpasses the level, then Resistance 2 may act as the crucial resistance level for the stock.


 Nov 12, 2026





 Please wait processing your request...