
 CA
 NZ
 UK
 US
 IND

 AU

 Share
 X (Formerly Twitter)
 Whatsapp
 Facebook
 LinkedIn
 Telegram
 Email This Article
 Copy Link
 Summarize with AI
 Chat GPT
 Perplexity

Key Highlights
- Goodman Group continues to leverage the massive secular tailwinds of global e-commerce logistics and the exponential demand for high-density data center infrastructure.
- Despite the persistent headwinds of a "higher-for-longer" interest rate environment, institutional capital is aggressively rotating back into this premium industrial REIT for its highly visible development pipeline.
- The technical price action is exceptionally bullish, characterized by a violent +3.98% surge that has decisively shattered a localized accumulation base and is now pressuring a dominant macro downtrend line.
While Goodman Group (ASX:GMG) spent the latter half of the past year suffering a brutal cyclical collapse under the weight of surging global bond yields, the technical landscape has just undergone a definitive and aggressive structural reversal. As the broader market frantically re-evaluates the valuation multiples of premium hard assets demonstrating resilient underlying cash flows and direct AI infrastructure exposure, GMG has successfully carved out a localized bottoming structure. The recent explosion in buying pressure suggests that the grueling distribution phase has thoroughly exhausted, paving the way for a dynamic new cyclical mark-up phase.
Logistics and Data Center Expansion
GMG’s fundamental investment thesis is heavily anchored to its elite position as a premier developer and manager of specialized industrial properties:
- Data Center Pipeline: A massive driver for GMG is its aggressive strategic pivot toward high-value data center developments. The exponential growth of generative AI requires massive power density and specialized facilities, positioning Goodman as a critical infrastructure partner for global hyperscalers.
- Industrial Logistics: The core business remains incredibly robust, anchored by strategically located logistics and warehousing assets. Near-zero vacancy rates in key global supply chain hubs provide immense pricing power, driving strong rental growth and organic revenue expansion.
- Capital Management: Unlike traditional, highly leveraged REITs, Goodman maintains a fortress balance sheet with substantial liquidity. This allows the company to comfortably self-fund its massive multi-billion-dollar global development workbook without being crippled by elevated wholesale borrowing costs.
Associated Risks
The primary risk for Goodman Group remains its sensitivity to macroeconomic discount rates and global bond yields. If inflation remains fiercely sticky and central banks are forced to maintain elevated terminal rates, the cost of capital will persist as a headwind for real estate valuations. Furthermore, any sudden regulatory hurdles, supply chain bottlenecks, or power grid constraints in key development markets could delay its highly anticipated data center rollouts, deferring critical future earnings recognition.
Technical Outlook
The daily chart for Goodman Group provides a textbook masterclass in structural exhaustion and breakout mechanics, highlighting a sudden, violent transition from a localized accumulation base into a fresh momentum phase.
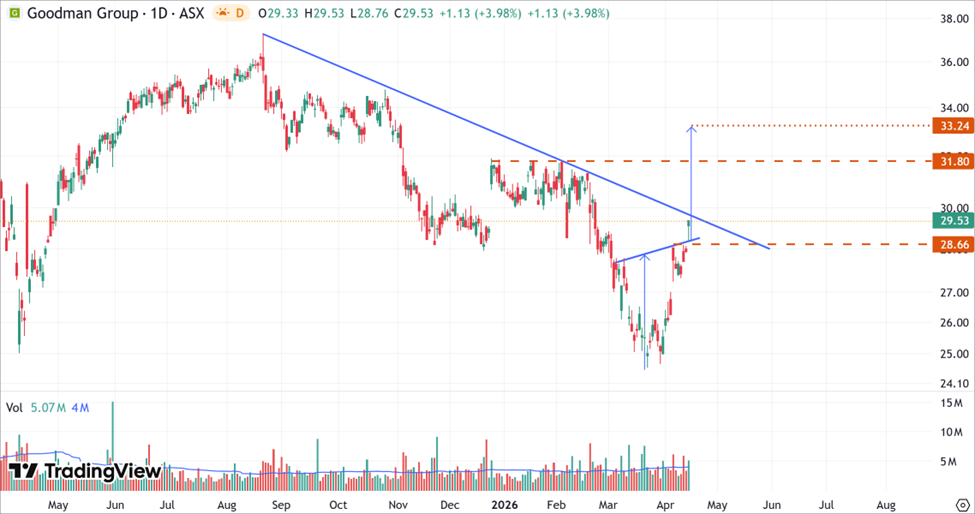
GMG’s Daily Price Chart (at the closing price of 16th April 2026). Powered by: tradingview.com
- On the daily chart, GMG’s stock price has completed an Inverse Head and Shoulders pattern coupled with strong trading volume, indicating a short-term trend reversal from a downtrend to an uptrend.
- With the primary breakout confirmed, the initial path of least resistance points directly toward a re-test of the prior intermediate horizontal peak at $31.08. If the stock decisively clears this resistance ceiling, it opens the door to the pattern's full measured move, which projects a macro target of $32.24.
Bottom Line
Goodman Group (ASX:GMG) presents a highly attractive alignment of fundamental AI infrastructure tailwinds and pristine, high-momentum technical execution. The forceful resolution of the localized bottoming pattern, fueled by a +3.98% daily surge on elevated volume, suggests the short-term path of least resistance is now firmly back to the upside. Active investors should closely monitor the impending test of the descending blue macro trendline. A confirmed structural breakout above this dynamic ceiling would definitively end the bear cycle and heavily favor an advance toward the $31.80 intermediate peak, with momentum ultimately pointing toward the $33.24 measured move objective.


 Nov 12, 2026





 Please wait processing your request...