
 CA
 NZ
 UK
 US
 IND

 AU

 Share
 X (Formerly Twitter)
 Whatsapp
 Facebook
 LinkedIn
 Telegram
 Email This Article
 Copy Link
 Summarize with AI
 Chat GPT
 Perplexity

Key Highlights
- Goodman Group (ASX:GMG) has developed a prominent Head & Shoulders pattern following a strong medium-term recovery.
- The stock has broken below the key neckline around $28.56, weakening the recent bullish structure.
- GMG closed at $27.27, below the neckline following a sharp decline.
- The chart identifies initial downside support around $24.64, representing the projected target from the Head & Shoulders formation.
- Above-average trading Volume strengthens confirmation of the bearish breakdown.
Goodman Group (ASX:GMG) has formed a potential bearish Reversal structure after recovering strongly from its early-2026 lows. The latest decline has pushed the stock below the neckline around $28.56, signalling a deterioration in the medium-term technical outlook.
Strong Operating Fundamentals Provide a Longer-Term Backdrop
Goodman Group continues to benefit from its exposure to logistics and data centre infrastructure. The company’s strong operating performance provides a supportive fundamental backdrop, although the latest price action suggests that short- to medium-term momentum has weakened.
Associated Risks
The primary risk is the recent Head & Shoulders breakdown. A sustained move below the $28.56 neckline would strengthen the bearish signal and increase the probability of further downside toward $24.64.
Conversely, a recovery above $28.56 would weaken the bearish setup and could indicate that the breakdown has failed.
Technical Outlook
GMG's Daily Chart indicates that its medium-term recovery is losing momentum as the stock breaks below a prominent Head & Shoulders pattern.
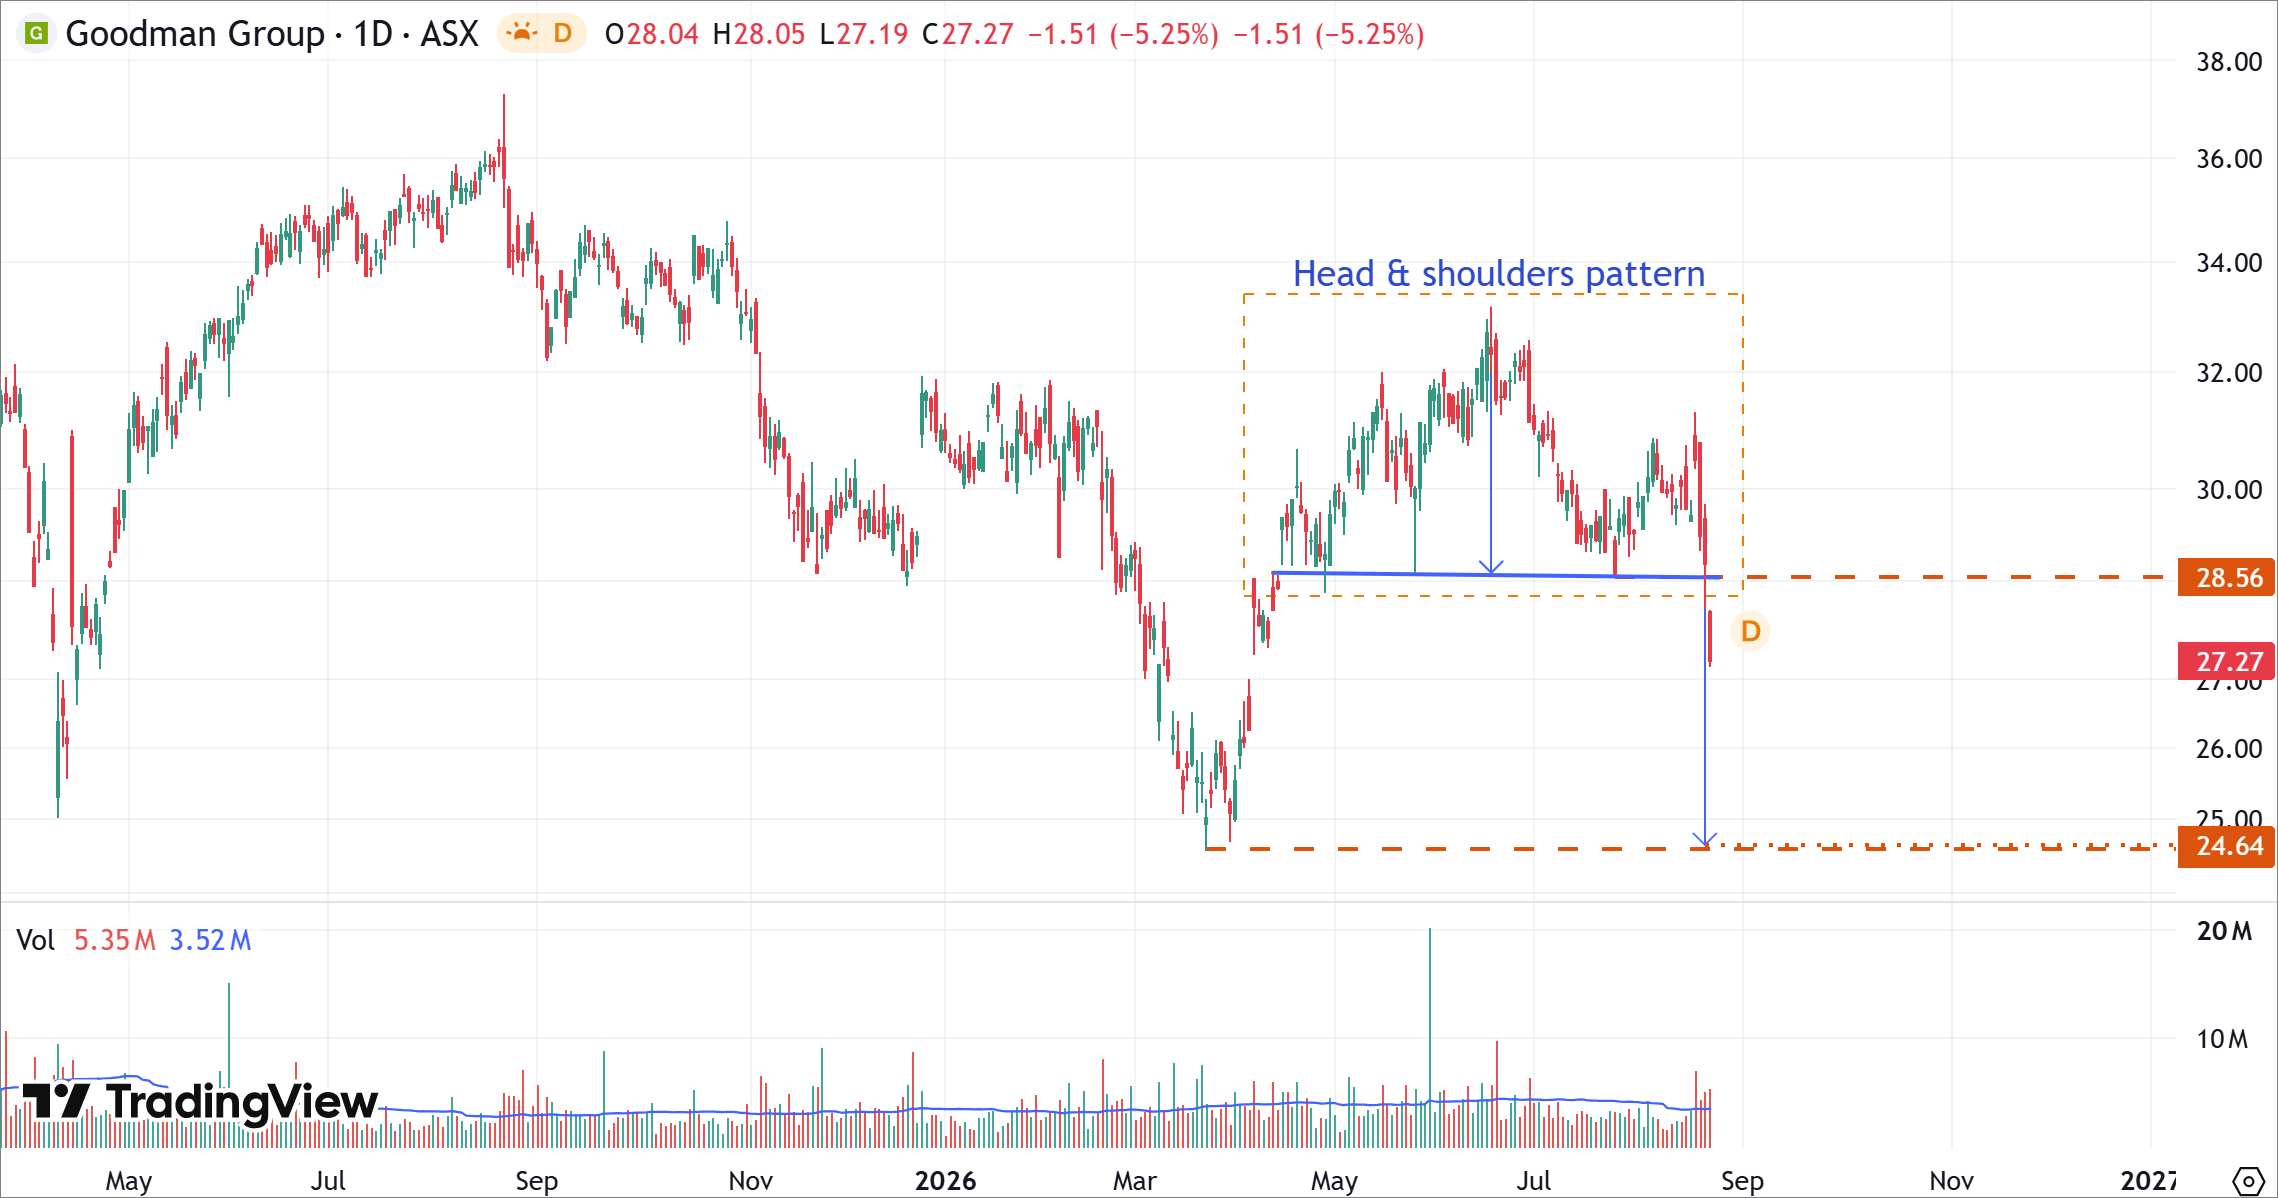
GMG's Daily Price Chart (at the closing price of 21/08/2026). Powered by: tradingview.com.
- GMG has developed a Head & Shoulders pattern, with the head reaching around $33 and the neckline positioned near $28.56.
- The stock has broken below the neckline, providing an initial bearish signal and weakening the previous bullish structure.
- The $24.64 level represents the major downside objective shown on the chart, which aligns to the March 2026 low.
- Above-average trading volume adds confirmation to the recent breakdown.
- A recovery above $28.56 would weaken the bearish setup, while sustained trading below this level would increase the likelihood of further downside.
Bottom Line
Goodman Group's strong operating fundamentals provide a supportive longer-term backdrop, but the latest price action indicates that short- to medium-term momentum has weakened.
Technically, GMG has broken below the neckline of a prominent Head & Shoulders pattern around $28.56. With the stock trading at $27.27, the $24.64 level represents the major downside objective shown on the chart. Unless GMG recovers above the neckline, the bearish setup remains intact and further downside risk should be considered.


 Nov 12, 2026





 Please wait processing your request...