
 CA
 NZ
 UK
 US
 IND

 AU

 Share
 X (Formerly Twitter)
 Whatsapp
 Facebook
 LinkedIn
 Telegram
 Email This Article
 Copy Link
 Summarize with AI
 Chat GPT
 Perplexity

Image source: Shutterstock
Highlights
- In 1HFY25, GMG’s statutory profit soared by 463.4% YoY to AUD 799.8 million, compared to AUD 220.1 million net loss in 1HFY24.
- The company expects OEPS growth of 9% for FY25, factoring in new securities.
- Distribution forecast stands at 30 cents per security in FY25.
Goodman Group Ltd (ASX:GMG), an integrated property group, continues to bolster its global strategy in FY25, positioning itself as a key provider of essential infrastructure. The company’s adaptability to the shifting economic and technological landscape opens new avenues for data centre development in metropolitan regions, reinforcing its commitment to long-term growth.
Financial Performance in 1HFY25
In the six months ended 31 December 2024 (1HFY25), Goodman’s revenue surged by 25.2% YoY to AUD 1,339.1 million, up from AUD 1,069.7 million in the same period of FY24. This growth was fuelled by increased gross property and development income. Operating profit rose 8.4% YoY to AUD 1,222.4 million in 1HFY25, while statutory profit attributable to security holders soared by 463.4% YoY to AUD 799.8 million, reversing the previous year’s net loss of AUD 220.1 million.
For the half year, the company declared a dividend of 15 cents per security.
Strategic Capital Initiatives
On 27 February 2025, Goodman launched a Security Purchase Plan (SPP) following a successful AUD 4.0 billion institutional placement. The SPP, aiming to raise up to AUD 400 million, remains open until 13 March 2025.
The funds will be used to pursue several growth opportunities across the company’s data centre and logistics operations, with a short-term focus on reducing gearing.
Outlook
Goodman expects a 9% growth in operating earnings per security (OEPS) for FY25 and it includes the new securities issued through the equity raise. During FY25, the projected distribution stands at 30 cents per security.
Key Performance Insights
Positives:
- Higher Net Margin: 59.7% in 1HFY25, surpassing the industry median of 39.8%.
- Return on Equity (ROE) Turns Positive: +4.4% in 1HFY25, a significant improvement from -1.2% in 1HFY24.
Challenges:
- Decreased Gross Profit Margin: 56.9% in 1HFY25, down from 80.4% in 1HFY24.
- Increased Debt/Equity Ratio: 0.31x in 1HFY25, rising from 0.19x in 1HFY24.
Additionally, external factors such as economic uncertainty, currency fluctuations, regulatory constraints, and inflationary pressures remain key risks.
Constructive Indicators
According to data released by the Australian Bureau of Statistics (ABS) on 27 February 2025, private new capital expenditure (capex) has decreased by nearly 0.2% sequentially and rose by 0.6% annually in December 2024 quarter. Notably, the capex on buildings and structures increased by 0.2%, and fell by 0.8% on equipment, plant, and machinery.
Share performance of GMG
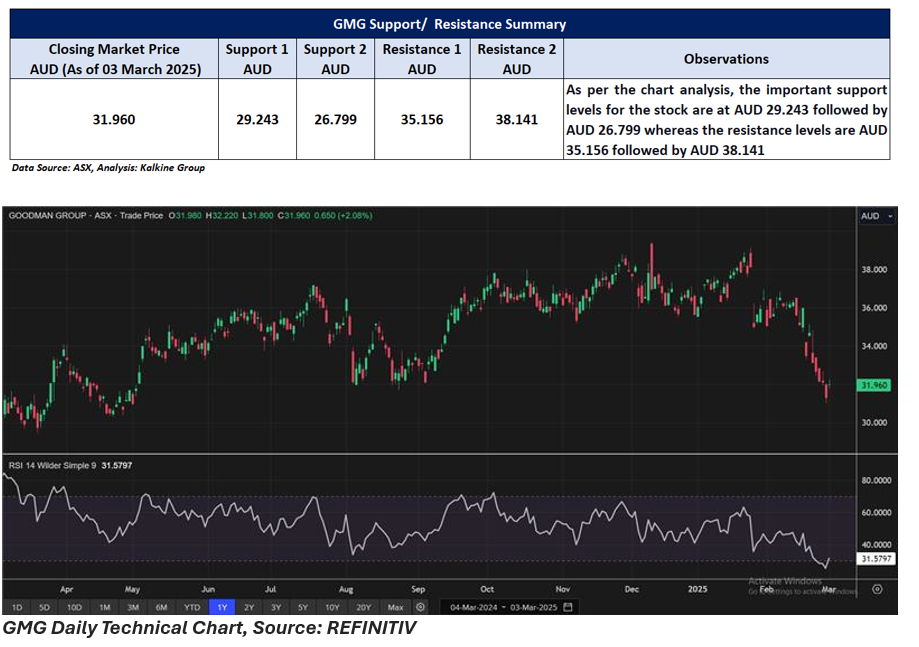
GMG shares closed 2.08% higher at AUD 31.96 per share on 3 March 2025. The stock price has dropped by almost 12.32% in a month and has gained 4.86% in one year.
52-week high of GMG is AUD 39.43, recorded on 10 December 2024 and 52-week low is AUD 29.46, recorded on 18 March 2024.
Support and Resistance Summary
Note 1: Past performance is neither an Indicator nor a guarantee of future performance.
Note 2: The reference date for all price data, and currency, is 03 March 2025. The reference data in this report has been partly sourced from EODHD/Others.
Technical Indicators Defined:
Support: A level at which the stock prices tend to find support if they are falling, and a downtrend may take a pause backed by demand or buying interest. Support 1 refers to the nearby support level for the stock and if the price breaches the level, then Support 2 may act as the crucial support level for the stock.
Resistance: A level at which the stock prices tend to find resistance when they are rising, and an uptrend may take a pause due to profit booking or selling interest. Resistance 1 refers to the nearby resistance level for the stock and if the price surpasses the level, then Resistance 2 may act as the crucial resistance level for the stock.


 Nov 12, 2026





 Please wait processing your request...