
 CA
 NZ
 UK
 US
 IND

 AU

 Share
 X (Formerly Twitter)
 Whatsapp
 Facebook
 LinkedIn
 Telegram
 Email This Article
 Copy Link
 Summarize with AI
 Chat GPT
 Perplexity
Highlights
- Price Trend Since June 2024: Gold prices have surged more than 100% since June 2024, supported by persistent U.S. dollar weakness, easing interest-rate expectations, and elevated global uncertainty tied to inflation trends and geopolitical risks, reinforcing its role as a safe-haven asset.
- Record High Levels: Prices climbed to a record high of USD 5,626.80, supported by a softer dollar environment and elevated risk aversion, which encouraged defensive allocation toward precious metals.
- Demand Structure: Gold demand reflects a balanced mix of price-sensitive jewellery consumption, led by India and China, macro-driven investment flows, steady and largely price-insensitive central bank buying, and a smaller yet stable technology segment.
- Policy-Related Volatility: Prices briefly came under pressure after U.S. President Donald Trump nominated Kevin Warsh as the next Federal Reserve Chair, raising expectations of a potentially less accommodative policy stance after Jerome Powell’s term ends in May.
Gold Overview
Since June 2024, gold has remained one of the most dynamic precious metals, balancing its role as a monetary hedge amid shifting macro conditions. On 02 February 2026, spot prices slipped 4.31% to USD 4,654.86 on hawkish policy rumours, reflecting short-term volatility rather than a structural shift. Despite the pullback, gold stayed on track for its strongest yearly gain since 2024. Persistent geopolitical and economic uncertainty continues to underpin safe-haven demand, pointing to reassessment rather than trend exhaustion.
Gold Prices Steady After Sharp Selloff as Policy Signals Drive Volatility
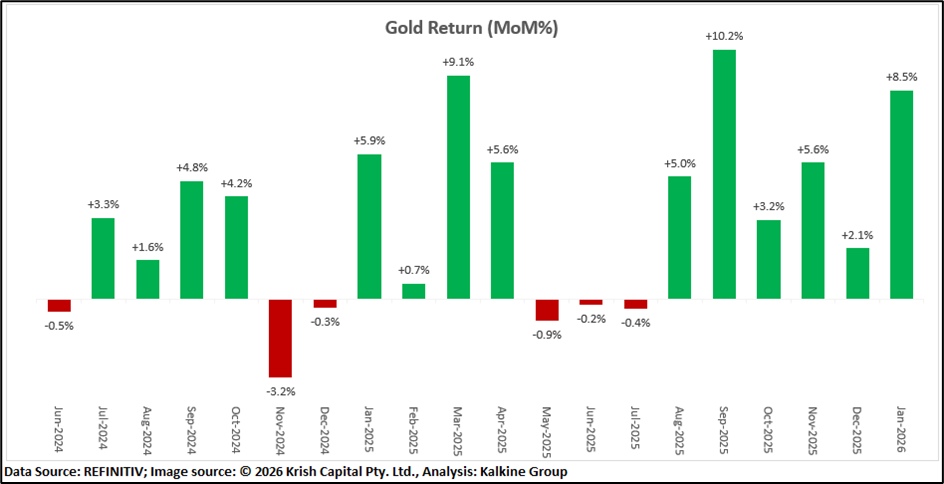
After hitting an all-time high, gold prices edged lower in early Asian trade following last week’s sharp selloff driven by profit-taking, U.S. dollar Index strength, and policy uncertainty. Despite touching a record USD 5,602.75 and posting gains of around 121.50% since mid-2024, gold slumped more than 10% in a single session as volatility spiked. The move followed Donald Trump's nomination of Kevin Warsh as the next Federal Reserve Chair, set to succeed Jerome Powell in May, alongside a rebound in the dollar index.
Technical View: Price Action Softens: Gold Dips Below Key Short-Term Average
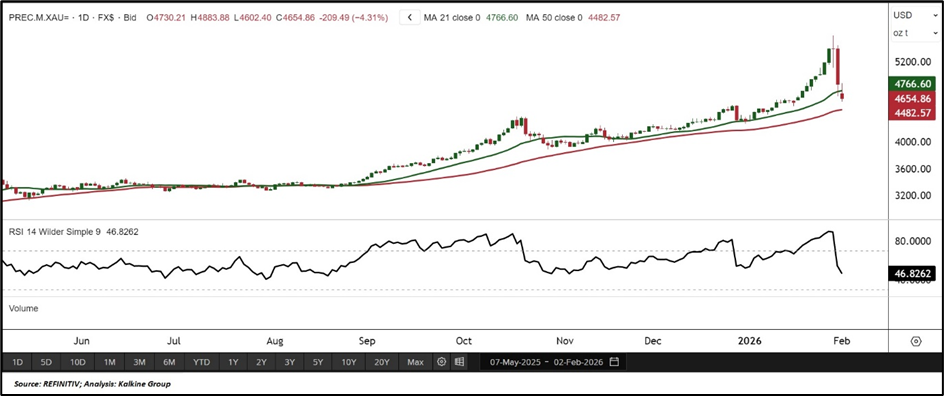
From a technical perspective, gold spot prices remain below the 21-day Simple Moving Average at USD 4,766.60, acting as immediate resistance, while the 50-day Simple Moving Average at USD 4,482.57 continues to support the broader structure. Momentum has already weakened following a sharp single-day decline of over 10%, highlighting aggressive profit-taking. The 14-day RSI at 46.82 has retreated from overbought levels, signalling cooling momentum. On the downside, support is seen near USD 4,400.00 and USD 3,800.00, while resistance stands around USD 4,900.00 and USD 5,500.00.
Bottom Line: Gold at a Crossroads After a Historic Run?
After doubling in two years, gold is entering a phase of reassessment rather than reversal. Short-term momentum has cooled amid profit-taking and policy uncertainty, but the broader structure remains supported by central bank demand and geopolitical risks. Near-term consolidation is likely as markets recalibrate expectations.


 Nov 12, 2026





 Please wait processing your request...