
 CA
 NZ
 UK
 US
 IND

 AU

 Share
 X (Formerly Twitter)
 Whatsapp
 Facebook
 LinkedIn
 Telegram
 Email This Article
 Copy Link
 Summarize with AI
 Chat GPT
 Perplexity

Image source: Shutterstock
Highlights
- FMG’s sales revenue fell 19.7% YoY to USD 7.64 billion in 1HFY25 and underlying EBITDA dropped 38.4% YoY to USD 3.64 billion due to rising costs.
- Recently, Usha Rao-Monari acquired 269 shares for AUD 4,999.12.
- FMG declared a dividend of AUD 0.50 per share, payable on 27 March 2025.
- Iron ore shipment of 190–200mn tonnes expected in FY25, with 5–9mn tonnes from Iron Bridge.
Fortescue Limited (ASX:FMG) is an ASX-listed exploration and production company that focuses on copper, gold, lithium, and rare earth elements. In the first half of the financial year 2025 (1HFY25), FMG’s operating sales revenue fell by 19.7% YoY to USD 7.64 billion, primarily due to lower price realisations and a decline in the Platts 62% CFR Index, despite steady demand for Hematite, which generated an average value of USD 85 per dry metric tonne (dmt).
The company’s underlying EBITDA contracted by 38.4% YoY in 1HFY25 to USD 3.64 billion, as rising production costs pushed C1 costs to USD 19.17 per wet metric tonne (wmt). However, total non-current assets increased by 2.25% YoY to USD 23.35 billion.
Key Business Developments
On 28 February 2025, FMG announced that Director Usha Rao-Monari acquired 269 FMG shares, amounting to AUD 4,999.12.
Recently, the company has announced a dividend of AUD 0.50 per share, with an ex-date of 26 February 2025 and a payment date set for 27 March 2025.
Outlook
In FY25, the company expects to achieve iron ore shipments of 190-200mn tonnes, including 5-9 million tonnes for Iron Bridge on a 100% basis.
FMG refined its capital expenditure range to USD 3.5–3.8 billion for FY25, up from the previous USD 3.2–3.8 billion. Fortescue Energy anticipates net operating expenses of around USD 700 million, with USD 400 million of capital expenditure in FY25.
C1 costs for Hematite are forecast to stabilise between USD 18.50 and USD 19.75 per wet metric tonne, aiming to balance production costs and profitability.
Strengths and Challenges
- Key Positives:
- Higher Net Margin: 20.3% in 1HFY25, outperforming the industry median of 12.4%.
- Higher Return on Equity (ROE): 8.0% versus the industry median of 5.7%.
- Key Negatives:
- Decreased Gross Margin: Fell to 40.2% from 57.2% in 1HFY24, reflecting pricing pressures.
- Declining Accounts Receivable Turnover: Dropped to 11.3x from 13.8x, indicating slower cash collection cycles.
Share performance of FMG
FMG shares closed 3.35% lower at AUD 16.15 per share on 4 March 2025. Over the past one year, FMG’s share price has dropped by nearly 36.32% and in a month, it has decreased by approximately 15.58%.
52-week high of FMG is AUD 27.67, recorded on 22 May 2024 and 52-week low is AUD 15.88, recorded on 10 September 2024.
Support and Resistance Summary
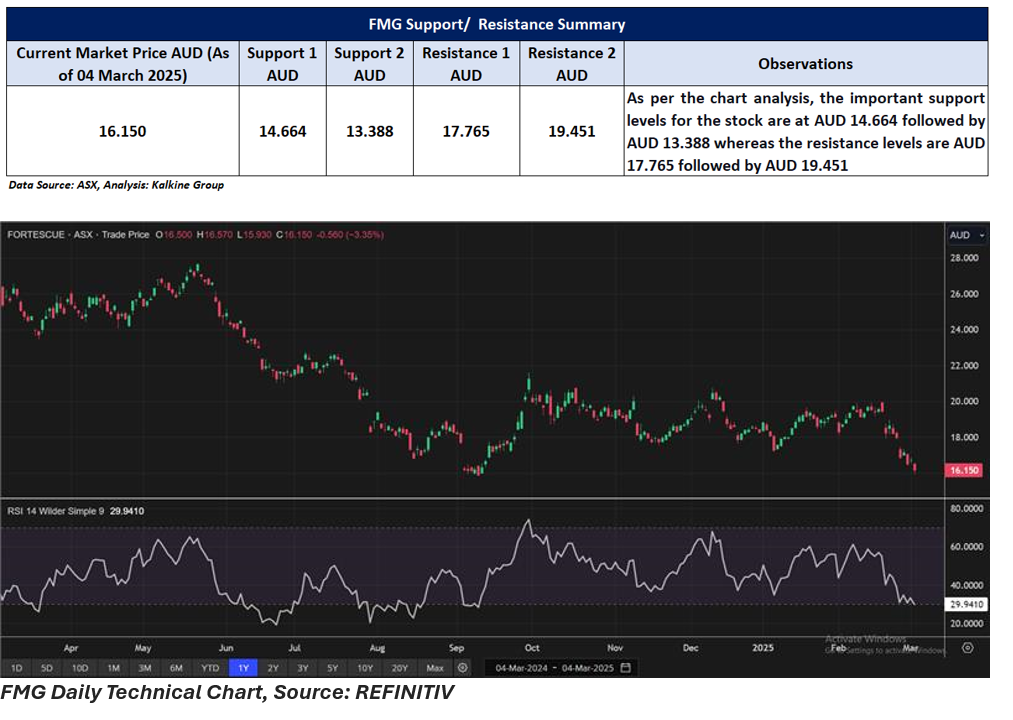
Note 1: Past performance is neither an Indicator nor a guarantee of future performance.
Note 2: The reference date for all price data, and currency, is 04 March 2025. The reference data in this report has been partly sourced from EODHD/Others.
Technical Indicators Defined:
Support: A level at which the stock prices tend to find support if they are falling, and a downtrend may take a pause backed by demand or buying interest. Support 1 refers to the nearby support level for the stock and if the price breaches the level, then Support 2 may act as the crucial support level for the stock.
Resistance: A level at which the stock prices tend to find resistance when they are rising, and an uptrend may take a pause due to profit booking or selling interest. Resistance 1 refers to the nearby resistance level for the stock and if the price surpasses the level, then Resistance 2 may act as the crucial resistance level for the stock.


 Nov 12, 2026





 Please wait processing your request...