
 CA
 NZ
 UK
 US
 IND

 AU

 Share
 X (Formerly Twitter)
 Whatsapp
 Facebook
 LinkedIn
 Telegram
 Email This Article
 Copy Link
 Summarize with AI
 Chat GPT
 Perplexity

Image source: Shutterstock
Highlights
- FLT’s revenue increased by 3.16% YoY to AUD 1.33 billion in H1FY25, while underlying EBITDA rose 0.82% YoY to AUD 192.7 million.
- FY25 UPBT guidance was revised to AUD 300–335 million, down from AUD 365–405 million.
- The company focuses on cost reductions, with capex cuts of 15–20% planned for FY26.
Flight Centre Travel Group Limited (ASX:FLT) is an ASX-listed leisure and corporate travel management company. It has reported modest growth in its financial results for the first half of the financial year 2025 (H1FY25). However, the company has revised its full-year guidance downward due to macroeconomic uncertainty and ongoing market volatility, particularly stemming from recent US policy changes.
H1FY25 Performance
In H1FY25, the company posted revenue of AUD 1.33 billion, reflecting a 3.16% YoY increasefrom AUD 1.29 billion in the previous corresponding period. Underlying EBITDA rose marginally by 0.82% YoY to AUD 192.7 million, while underlying profit after tax (PAT) increased 1.26% YoY to AUD 78.6 million.
During the reported period, the company reported total transaction value (TTV) of AUD 11.7 billion, bolstered by significant contributions from the corporate travel segment (AUD 6 billion) and global leisure business (AUD 5.5 billion). In Australia, international air ticket numbers rose by approximately 12%, though average fares dipped by 6.5% year-on-year. Margins held steady during the period.
Buyback Plans
On 28 April 2025, the company also revealed a capital management initiative, announcing an on-market share buy-back of up to AUD 200 million. The buyback will span 12 months beginning around 12 May 2025. Additionally, FLT is evaluating its Convertible Notes (CNs) to optimise its financial strategy.
Outlook
The company has revised in its FY25 underlying profit before tax (UPBT) to AUD 300–335 million, compared to the initial projection of AUD 365–405 million. The new midpoint aligns closely with FY24's UPBT of AUD 320 million.
The company continues to generate monthly profits and retains a significant balance sheet and liquidity position, aiming for improved performance in FY26 as economic conditions normalise.
Management is accelerating cost-cutting and productivity initiatives, including reducing headcount in non-customer-facing roles. A 15–20% reduction in capital expenditure is targeted for FY26 to support long-term earnings growth.
Share performance of FLT
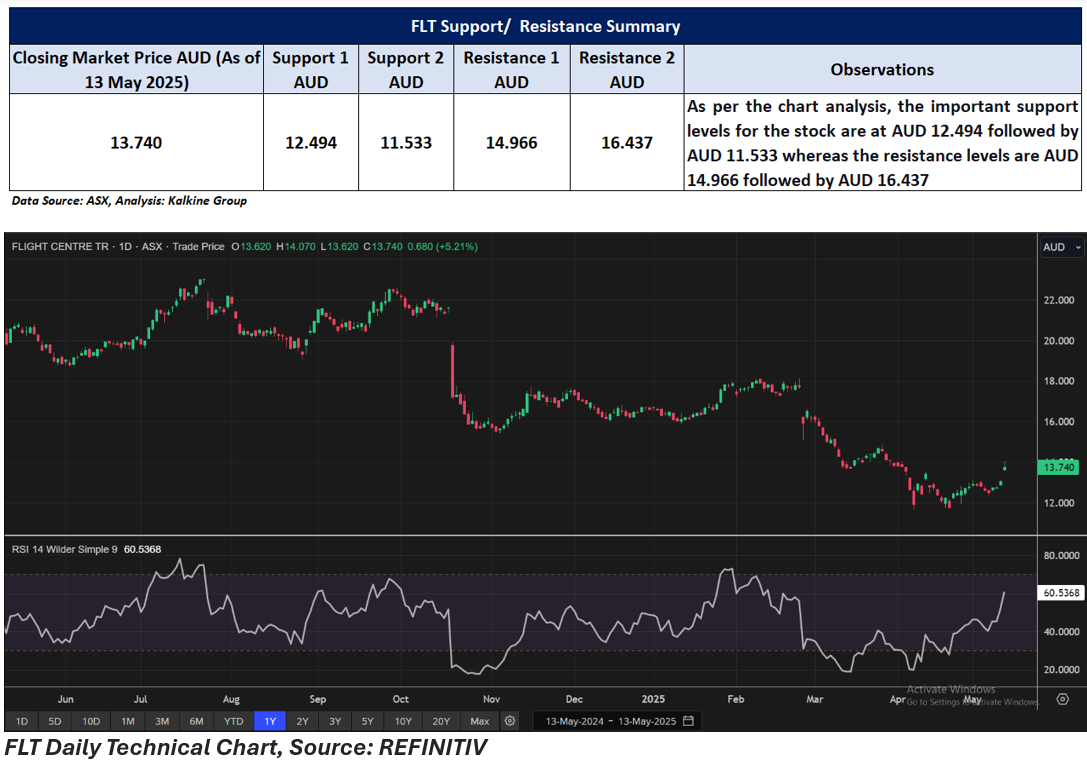
FLT shares closed 5.21% higher at AUD 13.74 per share on 13 May 2025. In the past five days, FLT’s share price jumped almost 8.96%, while in a year, it has fallen by almost 30.75%.
52-week high of FLT is AUD 23.06, recorded on 23 July 2024 and 52-week low is AUD 11.64, recorded on 7 April 2025.
Support and Resistance Summary
Note 1: Past performance is neither an Indicator nor a guarantee of future performance.
Note 2: The reference date for all price data, and currency, is 13 May 2025. The reference data in this report has been partly sourced from EODHD/Others.
Technical Indicators Defined:
Support: A level at which the stock prices tend to find support if they are falling, and a downtrend may take a pause backed by demand or buying interest. Support 1 refers to the nearby support level for the stock and if the price breaches the level, then Support 2 may act as the crucial support level for the stock.
Resistance: A level at which the stock prices tend to find resistance when they are rising, and an uptrend may take a pause due to profit booking or selling interest. Resistance 1 refers to the nearby resistance level for the stock and if the price surpasses the level, then Resistance 2 may act as the crucial resistance level for the stock.


 Nov 12, 2026





 Please wait processing your request...