
 CA
 NZ
 UK
 US
 IND

 AU

 Share
 X (Formerly Twitter)
 Whatsapp
 Facebook
 LinkedIn
 Telegram
 Email This Article
 Copy Link
 Summarize with AI
 Chat GPT
 Perplexity

Key Highlights
- ELS's previously completed double top pattern has already triggered a bearish Reversal and remains an important part of the broader technical structure.
- The stock is now developing a potential Head & Shoulders pattern, with the neckline positioned around $5.00.
- ELS has recently fallen below the previous support near $5.46, increasing selling pressure and bringing the stock closer to the neckline.
- A decisive break below the $5.00 neckline would confirm the potential Head & Shoulders pattern and strengthen the bearish outlook.
- The pattern projects a potential downside target near $3.19, while $3.50 represents an important intermediate support level.
- The $5.46-$5.50 area has become the first resistance zone, while $5.00 is the key support to monitor.
Elsight Ltd (ASX: ELS) remains under significant technical pressure after completing a double top reversal and subsequently declining toward a critical support area. The stock is now forming a potential Head & Shoulders pattern, which could represent a second bearish reversal formation following the completed double top. With the share price approaching the neckline around $5.00, a decisive breakdown could trigger another significant leg lower.
The Mission-Critical Connectivity Growth Story
Elsight's long-term Investment thesis continues to be supported by its Leadership in mission-critical connectivity solutions and its exposure to several high-growth technology markets:
- Proprietary Connectivity Platform: Elsight's flagship Halo platform aggregates multiple wireless networks into a single resilient communication link, delivering highly reliable connectivity for defence, drones, public safety, and industrial applications.
- Exposure to Structural Growth Markets: The accelerating adoption of autonomous systems, unmanned aerial vehicles (UAVs), and AI-enabled technologies continues to drive Demand for secure, low-latency communication infrastructure.
- Expanding Commercial Partnerships: Elsight continues strengthening its global presence through strategic partnerships and customer deployments across defence, emergency services, and enterprise markets.
- Scalable Business Model: As customer adoption expands, the company's software-driven platform offers potential for Operating Leverage and increasing recurring software and service revenue.
Associated Risks
Although the potential Head & Shoulders formation presents a bearish setup, the pattern has not yet been confirmed because the neckline around $5.00 remains intact.
A sustained recovery above $5.46 would represent an initial improvement in short-term price momentum and could reduce the probability of an immediate neckline breakdown. A stronger move above the recent swing highs would further weaken the potential Head & Shoulders structure.
The main technical risk to the bearish scenario is therefore a failed pattern. If buyers successfully defend the $5.00 neckline and push the share price higher, the potential Head & Shoulders formation could become invalid.
Elsight also remains sensitive to company-specific developments, contract announcements, Earnings updates and broader investor sentiment toward technology, defence and autonomous-system companies. Positive developments could support a recovery despite the current technical weakness.
Technical Outlook
ELS's Daily Chart is developing a potential Head & Shoulders pattern after the previously completed double top reversal, with the stock now approaching the critical neckline around $5.00.
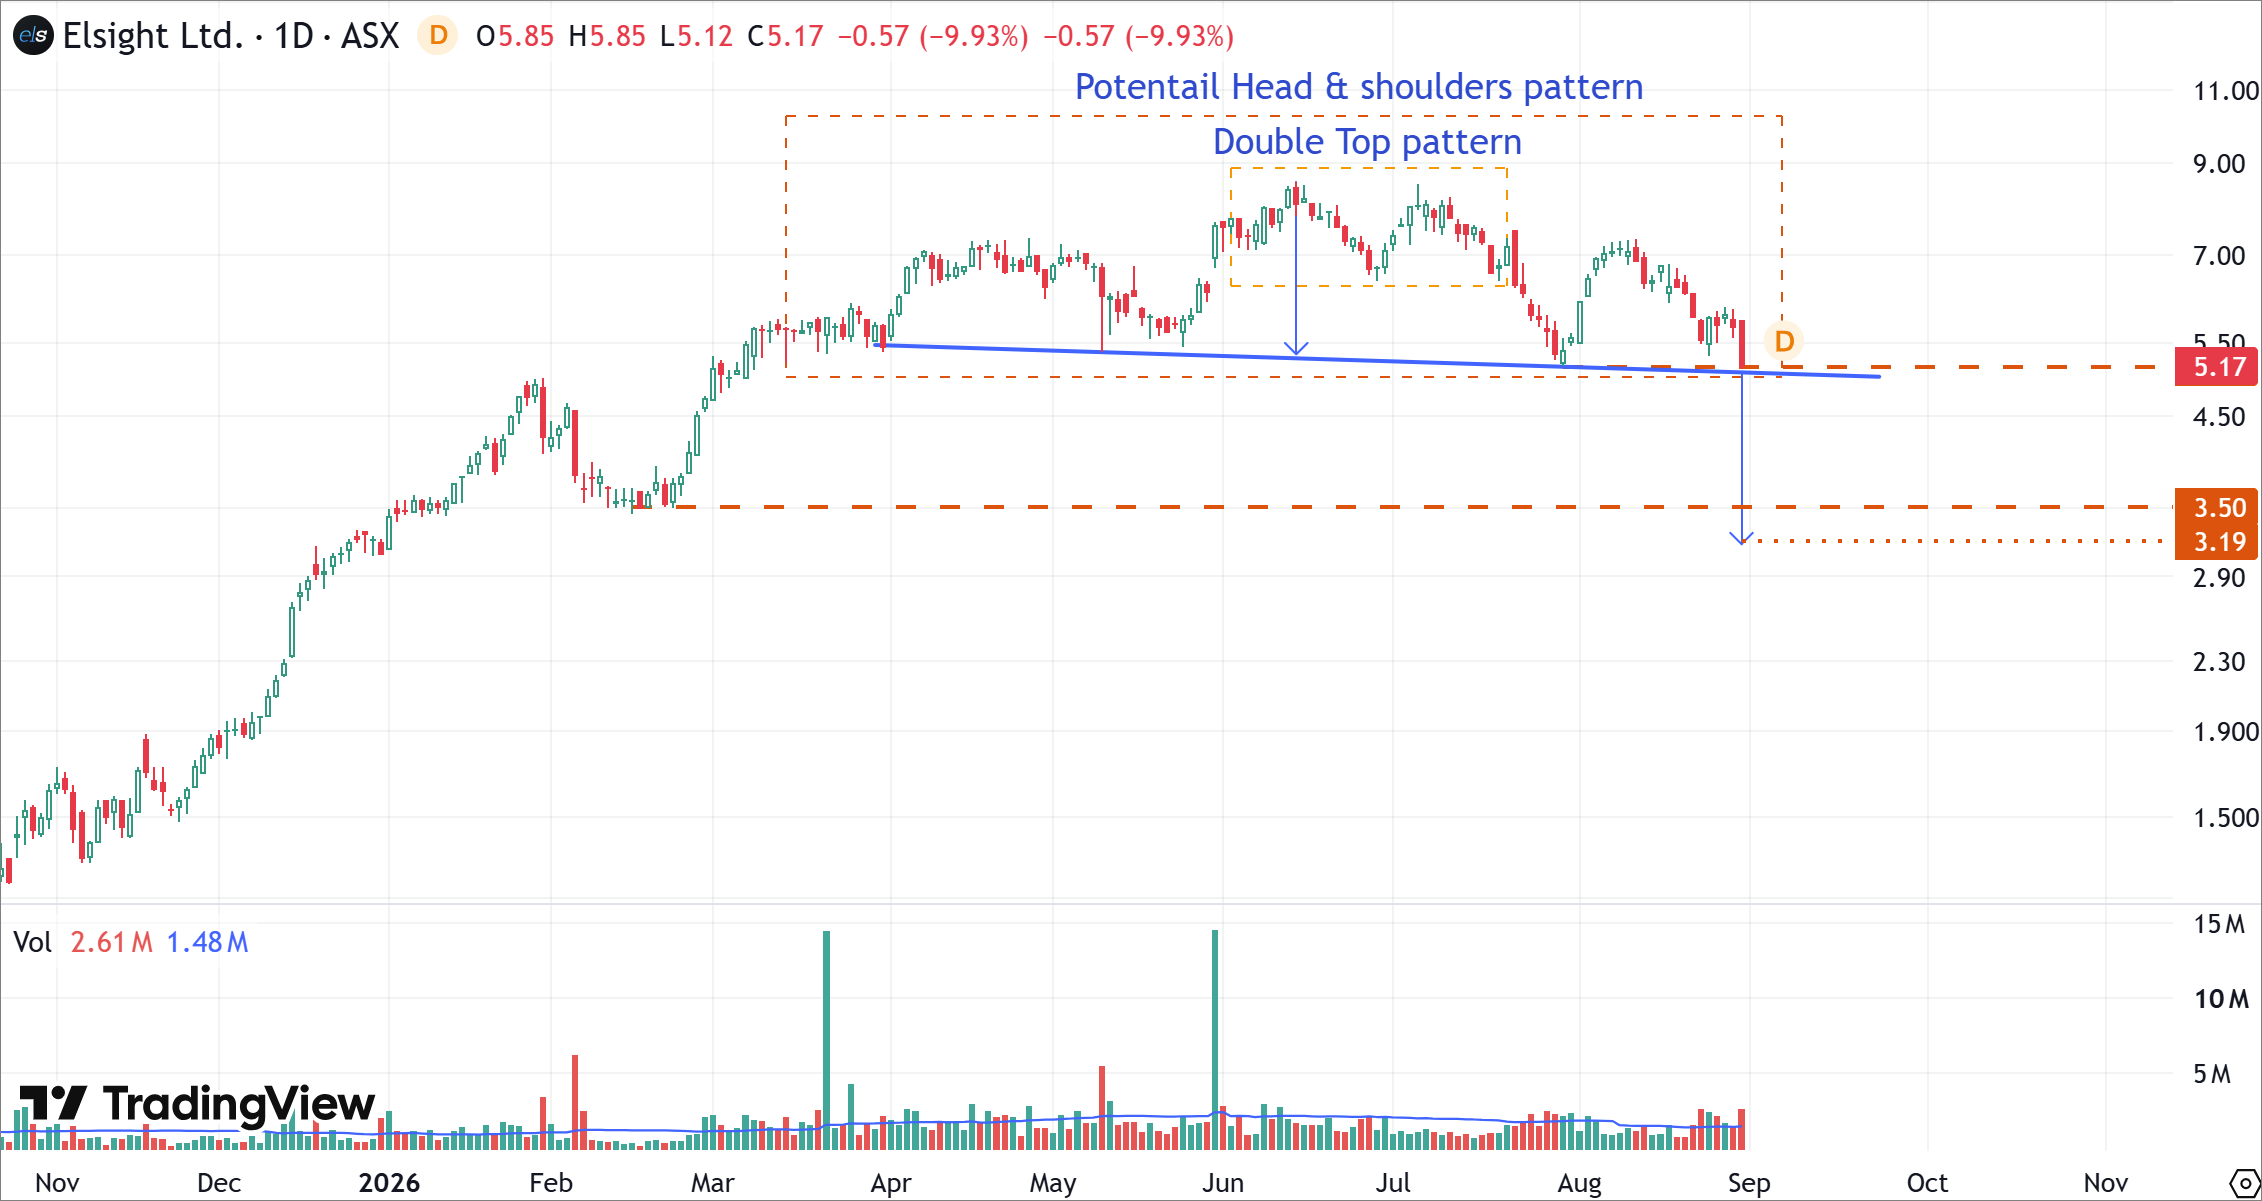
ELS's Daily Price Chart (at the closing price of 31/08/2026). Powered by: tradingview.com.
- The previous double top pattern has already completed, with the resulting decline establishing the broader bearish backdrop. The current technical focus has shifted to a potential Head & Shoulders formation developing at lower levels.
- The potential pattern consists of a left shoulder around the April-May period, a higher head around June, and a subsequent right shoulder developing during July-August. This structure suggests that buying momentum has weakened following the earlier advance.
- The neckline is positioned at $5.17 and represents the most important technical support for the potential pattern. ELS closed at $5.17 in the latest session, leaving the stock close to this critical level.
- The latest 9.93% decline reinforces the bearish momentum and increases the likelihood of a test of the neckline. However, the Head & Shoulders pattern remains unconfirmed until ELS decisively breaks below $5.17.
- A confirmed neckline breakdown would activate the bearish pattern and could expose the stock to the $3.50 area initially. The measured projection shown on the chart indicates a potential downside target near $3.19.
- On the upside, $5.46-$5.50 is the first resistance zone following the recent decline. A sustained recovery above this area would reduce immediate downside pressure and potentially delay the neckline test.
Bottom Line
Elsight Limited (ASX: ELS) remains technically vulnerable after the previously completed double top reversal and the subsequent deterioration in price momentum. The key development now is the formation of a potential Head & Shoulders pattern, with ELS approaching its neckline at $5.17.
Technically, a decisive break below $5.17 would confirm the Head & Shoulders formation and could open the way toward the $3.50 support area, with the chart indicating a potential downside target near $3.19. Until the neckline is broken, however, the pattern remains unconfirmed. A recovery above $5.46 would provide the first indication that selling pressure is easing, while a sustained break below $5.17 would materially strengthen the bearish outlook.


 Nov 12, 2026





 Please wait processing your request...