
 CA
 NZ
 UK
 US
 IND

 AU

 Share
 X (Formerly Twitter)
 Whatsapp
 Facebook
 LinkedIn
 Telegram
 Email This Article
 Copy Link
 Summarize with AI
 Chat GPT
 Perplexity

Key Highlights
- ELS's previously completed double top pattern established the broader bearish technical backdrop.
- The potential Head & Shoulders pattern has now been confirmed following a decisive break below the neckline around $5.15.
- ELS fell 8.72% in the latest session to close at $4.71, moving decisively below the key neckline.
- The confirmed Head & Shoulders pattern projects a potential downside target near $3.19, with $3.50 representing an important intermediate support level.
- The former $5.15-$5.17 neckline area is now the first major resistance zone, while $5.46-$5.50 remains a higher resistance area.
- The sharp breakdown indicates a significant deterioration in short-term price momentum and strengthens the bearish outlook.
Elsight Ltd (ASX: ELS) has experienced a significant technical breakdown after decisively falling below the neckline of its potential Head & Shoulders pattern. The stock declined 8.72% in the latest session to close at $4.71, confirming the bearish Reversal formation and opening the possibility of further downside toward the $3.50 support area and potentially the measured target near $3.19.
The breakdown follows the previously completed double top reversal, which had already established a broader bearish backdrop. The confirmed Head & Shoulders formation now represents a second bearish reversal structure and significantly increases downside risk.
The Mission-Critical Connectivity Growth Story
Elsight's long-term Investment thesis continues to be supported by its Leadership in mission-critical connectivity solutions and its exposure to several high-growth technology markets:
- Proprietary Connectivity Platform: Elsight's flagship Halo platform aggregates multiple wireless networks into a single resilient communication link, delivering highly reliable connectivity for defence, drones, public safety, and industrial applications.
- Exposure to Structural Growth Markets: The accelerating adoption of autonomous systems, unmanned aerial vehicles (UAVs), and AI-enabled technologies continues to drive Demand for secure, low-latency communication infrastructure.
- Expanding Commercial Partnerships: Elsight continues strengthening its global presence through strategic partnerships and customer deployments across defence, emergency services, and enterprise markets.
- Scalable Business Model: As customer adoption expands, the company's software-driven platform offers potential for Operating Leverage and increasing recurring software and service revenue.
Associated Risks
Elsight's fundamental growth story remains positive, supported by strong Revenue growth, expanding defence and commercial opportunities, and a growing backlog. However, the company remains exposed to execution risk, particularly the conversion of major contracts and opportunities into Recurring Revenue and sustained cash generation.
The business also faces competition and rapidly evolving technology markets, while delays in defence procurement or customer deployments could affect revenue growth. Despite its strong financial position, continued investment in product development and market expansion requires disciplined execution.
From a technical perspective, the confirmed Head & Shoulders breakdown remains the key near-term risk. Reclaiming $5.15-$5.17 would weaken the bearish signal, while continued weakness could expose ELS to $3.50 and potentially the $3.19 measured target..
Technical Outlook
ELS's Daily Chart has now confirmed the Head & Shoulders pattern after the stock decisively broke below the neckline around $5.15.
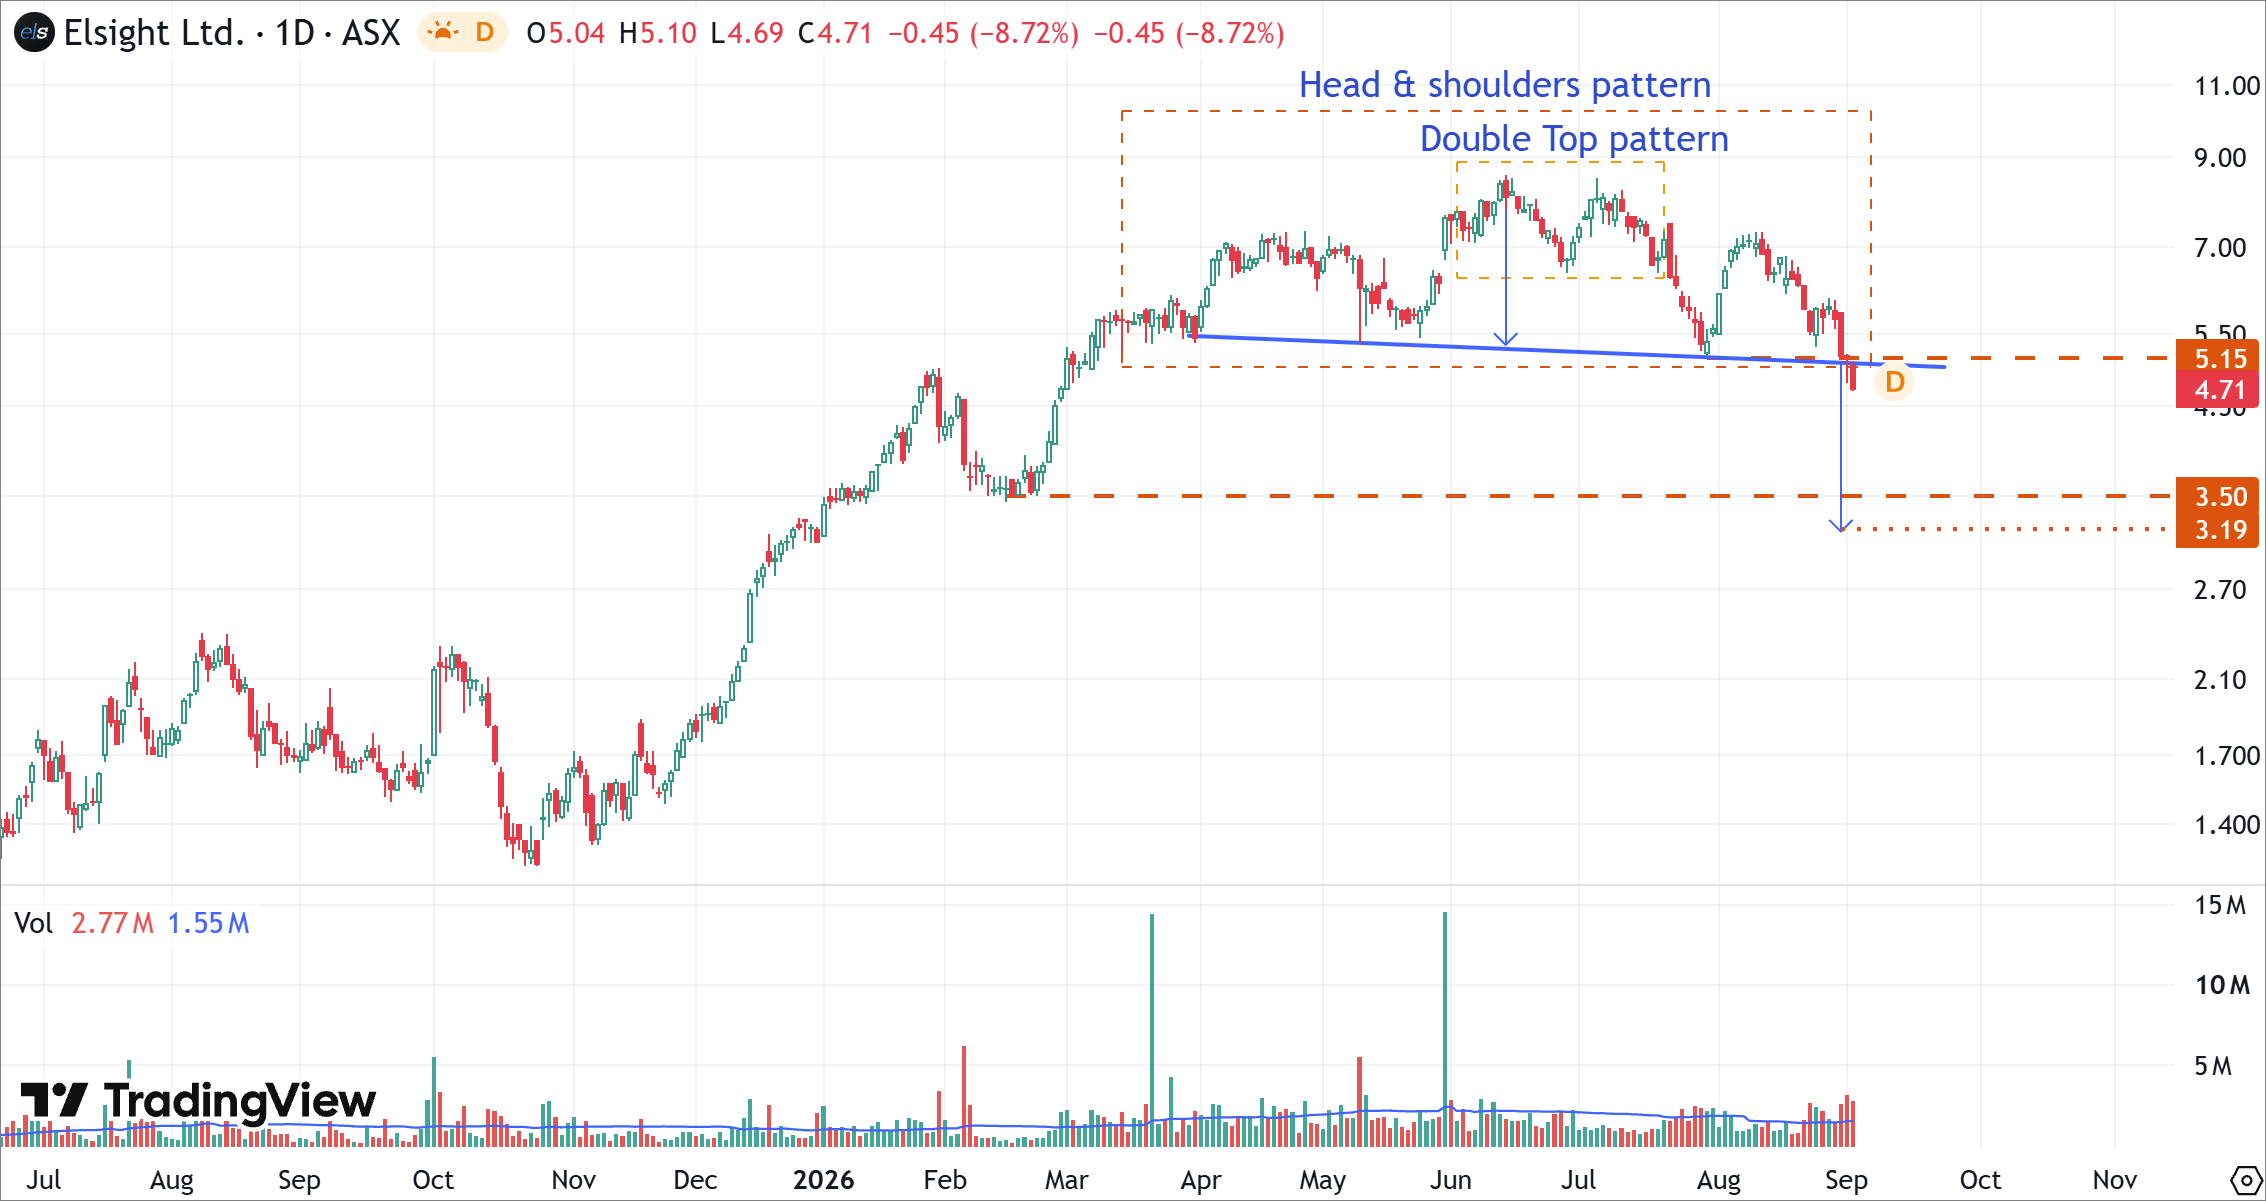
ELS's Daily Price Chart (at the closing price of 02/09/2026). Powered by: tradingview.com.
- The previous double top pattern has already completed, establishing the broader bearish backdrop. The current technical structure has now transitioned from a potential Head & Shoulders formation to a confirmed bearish reversal pattern.
- The pattern consists of a left shoulder around the April-May period, a higher head around June, and a subsequent right shoulder developing during July-August.
- The neckline was positioned around $5.15 and represented the key support for the formation. ELS has now decisively broken below this level and closed at $4.71.
- The latest 8.72% decline confirms the breakdown and indicates a significant acceleration in selling pressure.
- Following the neckline breakdown, the stock could initially test the $3.50 support area.
- The measured projection shown on the chart indicates a potential downside target near $3.19.
- On the upside, the former neckline around $5.15 is now the first important resistance zone. A sustained recovery above this level would weaken the immediate bearish signal, while a move above $5.50 would provide a stronger indication of recovery.
Bottom Line
Elsight Limited (ASX: ELS) has become technically more vulnerable following the decisive breakdown below the Head & Shoulders neckline. The stock's 8.72% decline to $4.71 has confirmed the bearish pattern and represents a significant deterioration in price momentum.
Technically, the confirmed Head & Shoulders formation could expose ELS to the $3.50 support area, followed by the chart's measured downside target near $3.19. The former $5.15 neckline is now the key resistance level. Unless ELS can reclaim this area, the bearish setup remains intact and further downside risk remains elevated.


 Nov 12, 2026





 Please wait processing your request...