
 CA
 NZ
 UK
 US
 IND

 AU

 Share
 X (Formerly Twitter)
 Whatsapp
 Facebook
 LinkedIn
 Telegram
 Email This Article
 Copy Link
 Summarize with AI
 Chat GPT
 Perplexity

Highlights
- FY25 statutory group revenue declined 7.0% YoY to AUD 12,267 million, with EBITDA down 8.3% YoY to AUD 556 million.
- Animal care segment revenue in FY25 grew 16.3% YoY to AUD 673 million, supported by branded business and SVS acquisition.
- FY26 underlying EBITDA targeted at AUD 615–635 million, with capex of AUD 130–140 million to complete distribution centre upgrades.
EBOS Group Limited (ASX: EBO), an ASX-listed marketer, wholesaler, and distributor of healthcare, medical, and pharmaceutical products, has 7.0% YoY drop in statutory group revenue to AUD 12,267 million for the period ended 30 June 2025 (FY25) from AUD 13,189 million in FY24, while statutory EBITDA fell 8.3% YoY to AUD 556 million.
The company also operates an animal care business as a brand owner, marketer, and distributor. Revenue from the animal care segment increased 16.3% YoY to AUD 673 million, driven by branded products and the recent SVS acquisition.
Factors Affecting FY25 Performance
EBOS highlighted that the loss of the Chemist Warehouse contract, competitive pressures in pharmacy wholesale, and transitional costs related to distribution centre upgrades and recent acquisitions affected near-term margins and overall revenue growth. Within the animal care segment, discretionary categories faced softer consumer spending, although the branded business contributed positively to segment expansion.
Performance Rights Update
On 5 January 2026, EBOS announced that 29,742 performance rights lapsed, leaving 1,451,060 performance rights currently on issue, according to an update filed with the NZX/ASX.
FY26 Outlook and Strategy
The company expects FY26 to be a transitional year as it completes its distribution centre renewal program, integrates acquisitions, and navigates ongoing competitive and macroeconomic pressures. Underlying EBITDA is targeted at AUD 615–635 million, representing approximately 7% growth at the midpoint.
FY26 capital expenditure is expected to range between AUD 130–140 million to finalize distribution centre upgrades, including increased capacity, cold storage, and efficiency improvements. Capex in future years is expected to be around 30% lower, with positive cash generation supporting growth, dividends and acquisitions.
From FY27 onwards, EBOS anticipates unlocking operational and financial leverage through automation benefits, removal of duplicated costs, lower capital expenditure, and productivity improvements.
Share Performance of EBO
EBO shares closed at AUD 22.54 per share on 14 January 2026, marking a slight intraday decline of 0.62%. The stock has experienced a substantial drop of 31.70% over the past year. It has also fallen 38.01% over six months, 34.19% over nine months, and 12.80% over the last three months. In the shorter term, the stock decreased 4.61% over one week and 6.00% over one month. The 52-week high was AUD 38.230, reached on 21 August 2025, while the 52-week low stood at AUD 22.680 as of 13 January 2026.
Support and Resistance Summary
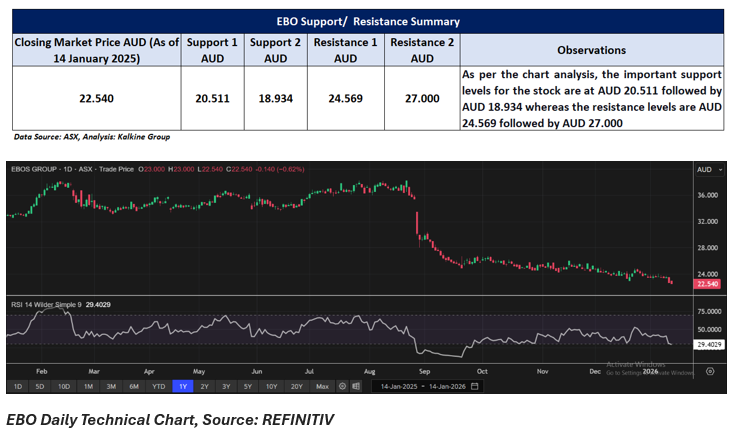
Note 1: Past performance is neither an Indicator nor a guarantee of future performance.
Note 2: The reference date for all price data, and currency, is 14 January 2026. The reference data in this report has been partly sourced from EODHD/Others.
Technical Indicators Defined:
Support: A level at which the stock prices tend to find support if they are falling, and a downtrend may take a pause backed by demand or buying interest. Support 1 refers to the nearby support level for the stock and if the price breaches the level, then Support 2 may act as the crucial support level for the stock.
Resistance: A level at which the stock prices tend to find resistance when they are rising, and an uptrend may take a pause due to profit booking or selling interest. Resistance 1 refers to the nearby resistance level for the stock and if the price surpasses the level, then Resistance 2 may act as the crucial resistance level for the stock.


 Nov 12, 2026





 Please wait processing your request...