
 CA
 NZ
 UK
 US
 IND

 AU

 Share
 X (Formerly Twitter)
 Whatsapp
 Facebook
 LinkedIn
 Telegram
 Email This Article
 Copy Link
 Summarize with AI
 Chat GPT
 Perplexity

Highlights
- EBOS Group’s FY25 revenue declined by 7%, mainly due to non-renewal of the CWA contract.
- Gross margin improved to 13.3%, and the current ratio increased to 1.18x in FY25.
- FY26 underlying EBITDA projected at AUD 615–635 million, supported by healthcare and animal care expansion.
EBOS Group Limited (ASX:EBO) is an Australasian company listed on the Australian Securities Exchange. The company specialises in the marketing, wholesale, and distribution of healthcare, medical, and pharmaceutical products.
Financial Performance
For the financial year ended 30 June 2025 (FY25), EBO reported a statutory revenue of AUD 12,267 million, down 7.0% from AUD 13,189 million in FY24. The decline was primarily due to the non-renewal of the CWA contract, although revenue was supported by organic growth, new customer acquisitions, and margin improvements from product mix and medical technology sales. The company generated an underlying free cash flow of AUD 302 million, achieving a cash realisation of 109% in FY25. During the same period, statutory net profit after tax (NPAT) decreased 20.8% YoY to AUD 215 million, compared with AUD 272 million in FY24. Operating cash flow improved by 20.2% YoY, rising to AUD 419 million in FY25 from AUD 348 million in the prior year.
Business Update
In late 2025, the company reported notable developments. On 3 November 2025, director Tracey Leigh Batten acquired 2,728 ordinary shares on-market, bringing her total holdings to 4,500 shares for NZD 77,020.61.
On 28 October 2025, the company opened a new Symbion pharmacy distribution centre at Kemps Creek, Western Sydney. The 56,000 m² automated facility serves 1,500 customers in New South Wales, enhances operational efficiency, and incorporates key sustainability initiatives. This centre is the sixth of eight sites in EBOS Group’s ongoing renewal program.
Key Positives and Negatives
In FY25, EBO gross margin rose to 13.3% from 12.4% in FY24. The current ratio improved to 1.18x in FY25 from 0.95x in FY24. Meanwhile, the asset turnover ratio fell to 1.75x from 2.00x in FY24 and cash cycle increased to 17.2 days from 15.8 day in FY 24.
Business outlook
For FY26, EBOS expects underlying EBITDA of AUD 615–635 million, around 7% growth, supported by healthcare and animal care expansion. Capex is projected at AUD 130–140 million to complete distribution centre upgrades, with future spending ~30% lower. The company will continue focusing on M&A and organic growth, targeting high-value products, medical technology, and animal care while maintaining disciplined capital allocation.
Share Performance of EBO
EBO’s shares were trading at AUD 24.950 per share on 12 November 2025 with an intraday gain of 2.55%. EBO’s stock has declined by 32.36% in last three months, 31.17% down over the six months, and decline by 27.04% over the past year. EBO’s 52-week high is AUD 38.23, recorded on 21 August 2025 and 52-week low is AUD 24.30, recorded on 11 November 2025.
Support and Resistance Summary
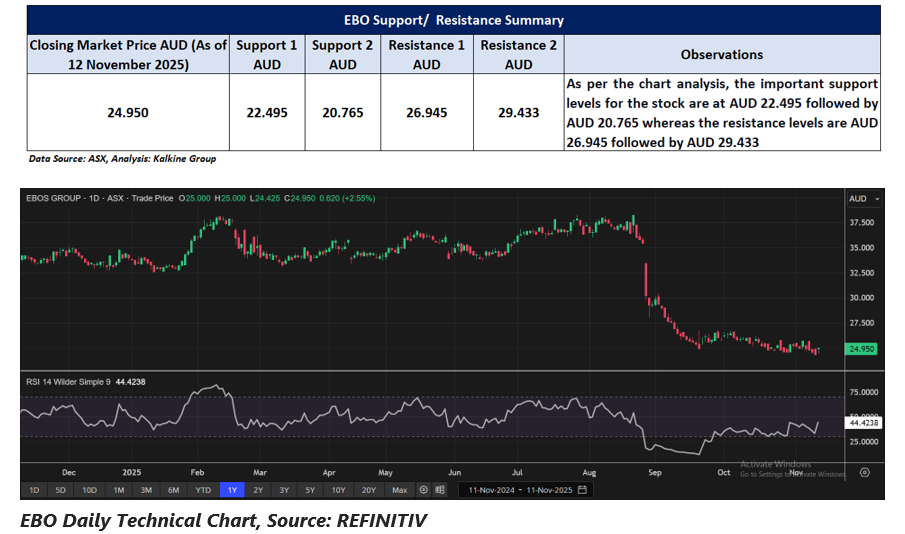
Note 1: Past performance is neither an Indicator nor a guarantee of future performance.
Note 2: The reference date for all price data, and currency, is 12 November 2025. The reference data in this report has been partly sourced from EODHD/Others.
Technical Indicators Defined:
Support: A level at which the stock prices tend to find support if they are falling, and a downtrend may take a pause backed by demand or buying interest. Support 1 refers to the nearby support level for the stock and if the price breaches the level, then Support 2 may act as the crucial support level for the stock.
Resistance: A level at which the stock prices tend to find resistance when they are rising, and an uptrend may take a pause due to profit booking or selling interest. Resistance 1 refers to the nearby resistance level for the stock and if the price surpasses the level, then Resistance 2 may act as the crucial resistance level for the stock.


 Nov 12, 2026





 Please wait processing your request...