
 CA
 NZ
 UK
 US
 IND

 AU

 Share
 X (Formerly Twitter)
 Whatsapp
 Facebook
 LinkedIn
 Telegram
 Email This Article
 Copy Link
 Summarize with AI
 Chat GPT
 Perplexity

Image source: Shutterstock
Highlights
- CBO’s revenue grew 9.67% YoY to AUD 124.77 million, with EBITDA surging 75.36% to AUD 14.45 million in 1HFY25.
- Net loss narrowed to AUD 4.46 million in 1HFY25, showing a 38.19% improvement over the previous year.
- Hasaka Martin was appointed sole company Secretary.
Cobram Estate Olives Limited (ASX: CBO) is an Australian company that specialises in the production and marketing of premium extra virgin olive oil. In the six months ended 31 December 2024 (1HFY25), CBO reported a 9.67% YoY increase in revenue, reaching AUD 124.77 million , compared to AUD 113.77 million in the prior corresponding period. A key highlight of the half-yearly performance was the 75.36% YoY surge in EBITDA, which climbed to AUD 14.45 million, compared to AUD 8.24 million in 1HFY24.
Despite these gains, the company recorded a net loss attributable to members of AUD 4.46 million, which, while still a loss, reflects a 38.19% YoY improvement from the AUD 7.22 million loss reported in the previous year’s first half.
During the reported period, the gross margin improved significantly to 20.4%, up from 14.8% in 1HFY24. Additionally, the accounts receivable turnover ratio increased to 6.5x, up from 6.0x a year earlier. Meanwhile, the current ratio, a measure of liquidity, declined from 1.73x in 1HFY24 to 1.61x in 1HFY25, while the debt-to-equity ratio increased marginally from 0.81x to 0.84x.
Leadership Changes
Through an ASX update dated 21 February 2025, CBO announced that Mr. Hasaka Martin would become the sole Company Secretary of CBO, following his departure from the Automic Group. Mr. Martin initially joined CBO as joint Company Secretary on 1 July 2024.
Outlook
Looking ahead, CBO remains optimistic about its sales, profitability, and operating cash flow in 2HFY25. The company is banking on improved consumer demand in Australia and the USA for its locally grown extra virgin olive oils. It also expects reported EBITDA for FY25 to be substantially higher than FY24, driven by both market growth and internal efficiencies.
Share performance of CBO
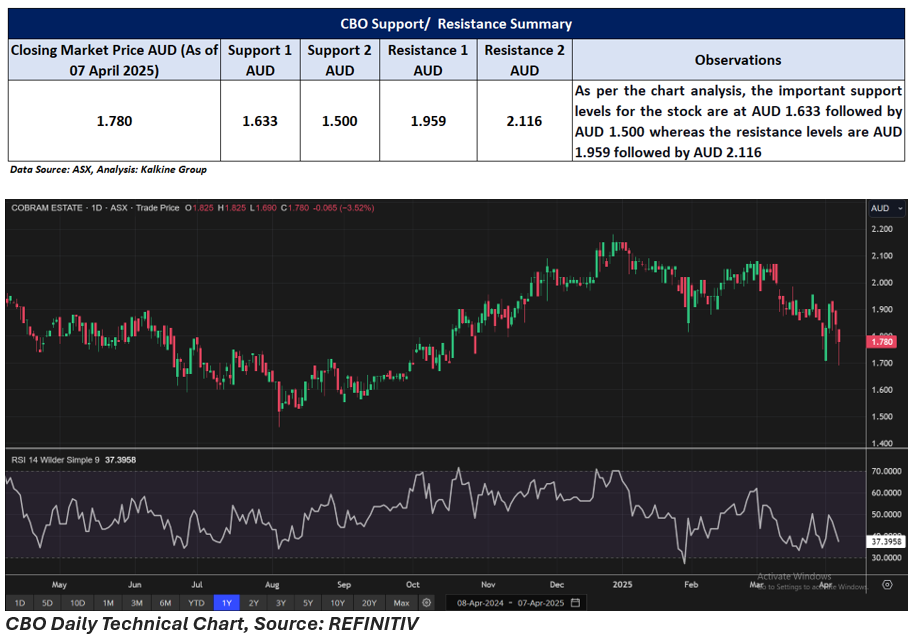
CBO shares closed 3.52% lower at AUD 1.78 per share on 7 April 2025. In the past year, CBO’s share price has dropped by nearly 8.72%, and in the past six months, it has increased by 4.09%.
52-week high of CBO is AUD 2.18, recorded on 27 December 2024 and 52-week low is AUD 1.46, recorded on 5 August 2024.
Support and Resistance Summary
Note 1: Past performance is neither an Indicator nor a guarantee of future performance.
Note 2: The reference date for all price data, and currency, is 07 April 2025. The reference data in this report has been partly sourced from EODHD/Others.
Technical Indicators Defined:
Support: A level at which the stock prices tend to find support if they are falling, and a downtrend may take a pause backed by demand or buying interest. Support 1 refers to the nearby support level for the stock and if the price breaches the level, then Support 2 may act as the crucial support level for the stock.
Resistance: A level at which the stock prices tend to find resistance when they are rising, and an uptrend may take a pause due to profit booking or selling interest. Resistance 1 refers to the nearby resistance level for the stock and if the price surpasses the level, then Resistance 2 may act as the crucial resistance level for the stock.


 Nov 12, 2026





 Please wait processing your request...