
 CA
 NZ
 UK
 US
 IND

 AU

 Share
 X (Formerly Twitter)
 Whatsapp
 Facebook
 LinkedIn
 Telegram
 Email This Article
 Copy Link
 Summarize with AI
 Chat GPT
 Perplexity

Image source: Shutterstock
Highlights
- Challenger’s net profit after tax (NPAT) rose by 12% YoY to AUD 225 million in H1FY25, driven by higher earnings across Life and Funds Management.
- Household wealth in Australia increased by 0.9% YoY (AUD 143.6 billion) in Q4 2024.
- The company reaffirmed its FY25 NPAT guidance at AUD 440-480 million, with the midpoint representing a 10% increase over FY24.
Challenger Limited (ASX:CGF) is an ASX-listed investment management company that operates two divisions – Life and Fund Management. In the first half of the financial year 2025 (H1FY25), the company reported a 12% annual increase in its normalised net profit after tax (NPAT), reaching AUD 225 million. This growth was driven by higher earnings across its Life and Funds Management segments, as well as strategic cost management initiatives.
Additionally, statutory NPAT surged 28% YoY to AUD 72 million in H1FY25, and group assets under management (AUM) grew 3% annually to AUD 131 billion, supported by positive investment market conditions. Challenger’s return on equity (ROE) rose 120 basis points to 11.6%, surpassing its 11.2% target.
Recent Developments and Outlook
On 25 March 2025, Challenger announced that State Street Corporation and its subsidiaries had acquired a 5.41% stake in the company, making them a substantial shareholder.
Looking ahead, Challenger’s management reaffirmed its FY25 NPAT guidance at AUD 440-480 million, with the midpoint representing a 10% increase over FY24.
Growth Prospects for Australian Financial Sector
According to the Australian Bureau of Statistics (ABS), household wealth rose by 0.9% (AUD 143.6 billion) in Q4 2024, driven by an increase in household deposits, which surged 3.2% (AUD 55.7 billion) in the same period.
In addition, credit demand remained robust, with total demand for credit standing at AUD 92.1 billion in the previous quarter. This was fuelled by private non-financial businesses (AUD 43.3 billion), household borrowing (AUD 37.2 billion), and government credit (-AUD 0.3 billion). These trends bode well for investment firms such as Challenger.
Share performance of CGF
CGF shares closed 1.15% lower at AUD 6.03 per share on 31 March 2025. Over the past year, CGF’s share price has dropped by almost 15.19% and in a month, it has increased by nearly 9.44%.
52-week high of CGF is AUD 7.57, recorded on 13 August 2024 and 52-week low is AUD 5.22, recorded on 13 March 2025.
Support and Resistance Summary
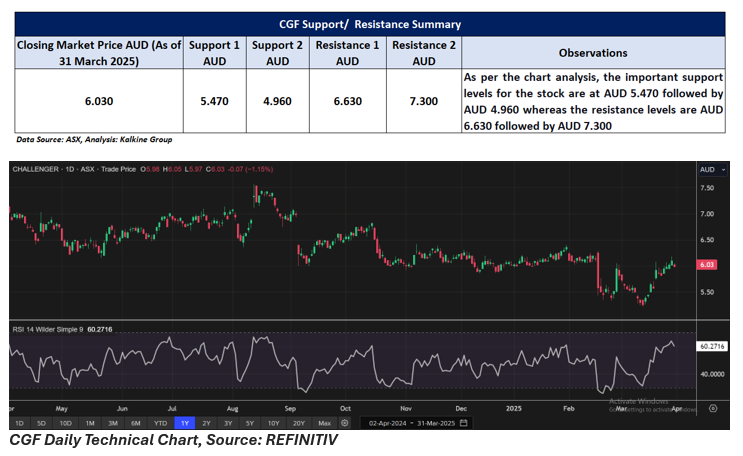
Note 1: Past performance is neither an Indicator nor a guarantee of future performance.
Note 2: The reference date for all price data, and currency, is 31 March 2025. The reference data in this report has been partly sourced from EODHD/Others.
Technical Indicators Defined:
Support: A level at which the stock prices tend to find support if they are falling, and a downtrend may take a pause backed by demand or buying interest. Support 1 refers to the nearby support level for the stock and if the price breaches the level, then Support 2 may act as the crucial support level for the stock.
Resistance: A level at which the stock prices tend to find resistance when they are rising, and an uptrend may take a pause due to profit booking or selling interest. Resistance 1 refers to the nearby resistance level for the stock and if the price surpasses the level, then Resistance 2 may act as the crucial resistance level for the stock.


 Nov 12, 2026





 Please wait processing your request...