
 CA
 NZ
 UK
 US
 IND

 AU

 Share
 X (Formerly Twitter)
 Whatsapp
 Facebook
 LinkedIn
 Telegram
 Email This Article
 Copy Link
 Summarize with AI
 Chat GPT
 Perplexity

Key Highlights
- CAR Group is a global digital marketplace Business operating leading automotive platforms across Australia, North America, Latin America and Asia.
- FY2026 reported Revenue increased 6% to $1.253 billion, while reported NPAT rose 14% to $314 million.
- Adjusted EBITDA increased 9% to $700 million, with 100% conversion of reported EBITDA to operating cash flow.
- CAR Group expects FY2027 revenue growth of 11–14% and adjusted NPAT growth of 9–12% in constant currency.
- Technically, CAR has completed a potential Inverse Head & Shoulders pattern and broken above the neckline and descending Trendline around $27.98.
- The breakout could signal a medium-term recovery, with the chart indicating a measured upside objective around $34.57.
After a prolonged decline from its 2025 peak, CAR Group Limited (ASX: CAR) has developed a well-defined potential Inverse Head & Shoulders pattern. The latest price action has pushed the stock decisively above the neckline around $27.98 and the descending trendline that had constrained the recovery since late 2025. This breakout suggests that selling pressure has weakened and buyers may be regaining control of the medium-term trend. Based on the measured-move projection shown on the chart, the next major technical objective is around $34.57.
Outstanding Fundamentals
CAR Group operates global digital marketplaces designed to facilitate vehicle buying and selling, with major platforms including carsales in Australia, Trader Interactive in North America, webmotors in Brazil and Encar in South Korea. The company continues to expand beyond traditional classifieds through dealer solutions, media, data, artificial intelligence and connected automotive ecosystems.
- Strong FY2026 Performance: Reported revenue increased 6% to $1.253 billion, while reported NPAT rose 14% to $314 million. Adjusted NPAT increased 8% to $407 million.
- Improving Profitability: Adjusted EBITDA increased 9% to $700 million, with EBITDA-to-operating-cash-flow conversion reaching 100%.
- Strong International Growth: On a constant-currency basis, revenue increased 12% in North America, 19% in Latin America and 15% in Asia, highlighting the contribution from the group's international operations.
- AI and Technology Investment: CAR Group continues to invest in AI-led search, personalisation, workflow tools and connected automotive ecosystems, while its CG/lab in Brazil is developing and scaling AI capabilities across the group.
- Positive FY2027 Outlook: Management expects revenue growth of 11–14%, adjusted EBITDA growth of 10–13% and adjusted NPAT growth of 9–12% in constant currency.
- Higher Shareholder Returns: The company declared a 43.5-cent final dividend, taking total FY2026 dividends to 86.0 cents per share, an increase of 8% from the previous year.
Associated Risks
Despite the improving technical structure and strong operating performance, several risks remain.
The Inverse Head & Shoulders breakout is still relatively recent, meaning CAR needs to sustain trading above the breakout zone around $27.98 to confirm that the move is genuine. A sustained decline back below this level would weaken the bullish setup and increase the risk of a failed breakout.
CAR Group is also exposed to broader economic conditions affecting vehicle transactions, Advertising spending and dealer activity. Changes in consumer demand, vehicle sales volumes, interest rates and economic conditions could influence marketplace activity and revenue growth.
The company's international operations also expose Earnings to foreign-exchange movements. Management's FY2027 guidance is provided on a constant-currency basis and remains subject to macroeconomic conditions, geopolitical risks, customer demand, Inflation and FX movements.
Furthermore, CAR Group is continuing to invest heavily in technology, AI and new automotive ecosystems. While these investments could support longer-term growth, weaker-than-expected returns on Investment or higher operating costs could place pressure on margins and profitability.
Technical Outlook
CAR's Daily Chart has developed a potentially important bullish Reversal following a breakout from a well-defined Inverse Head & Shoulders pattern.
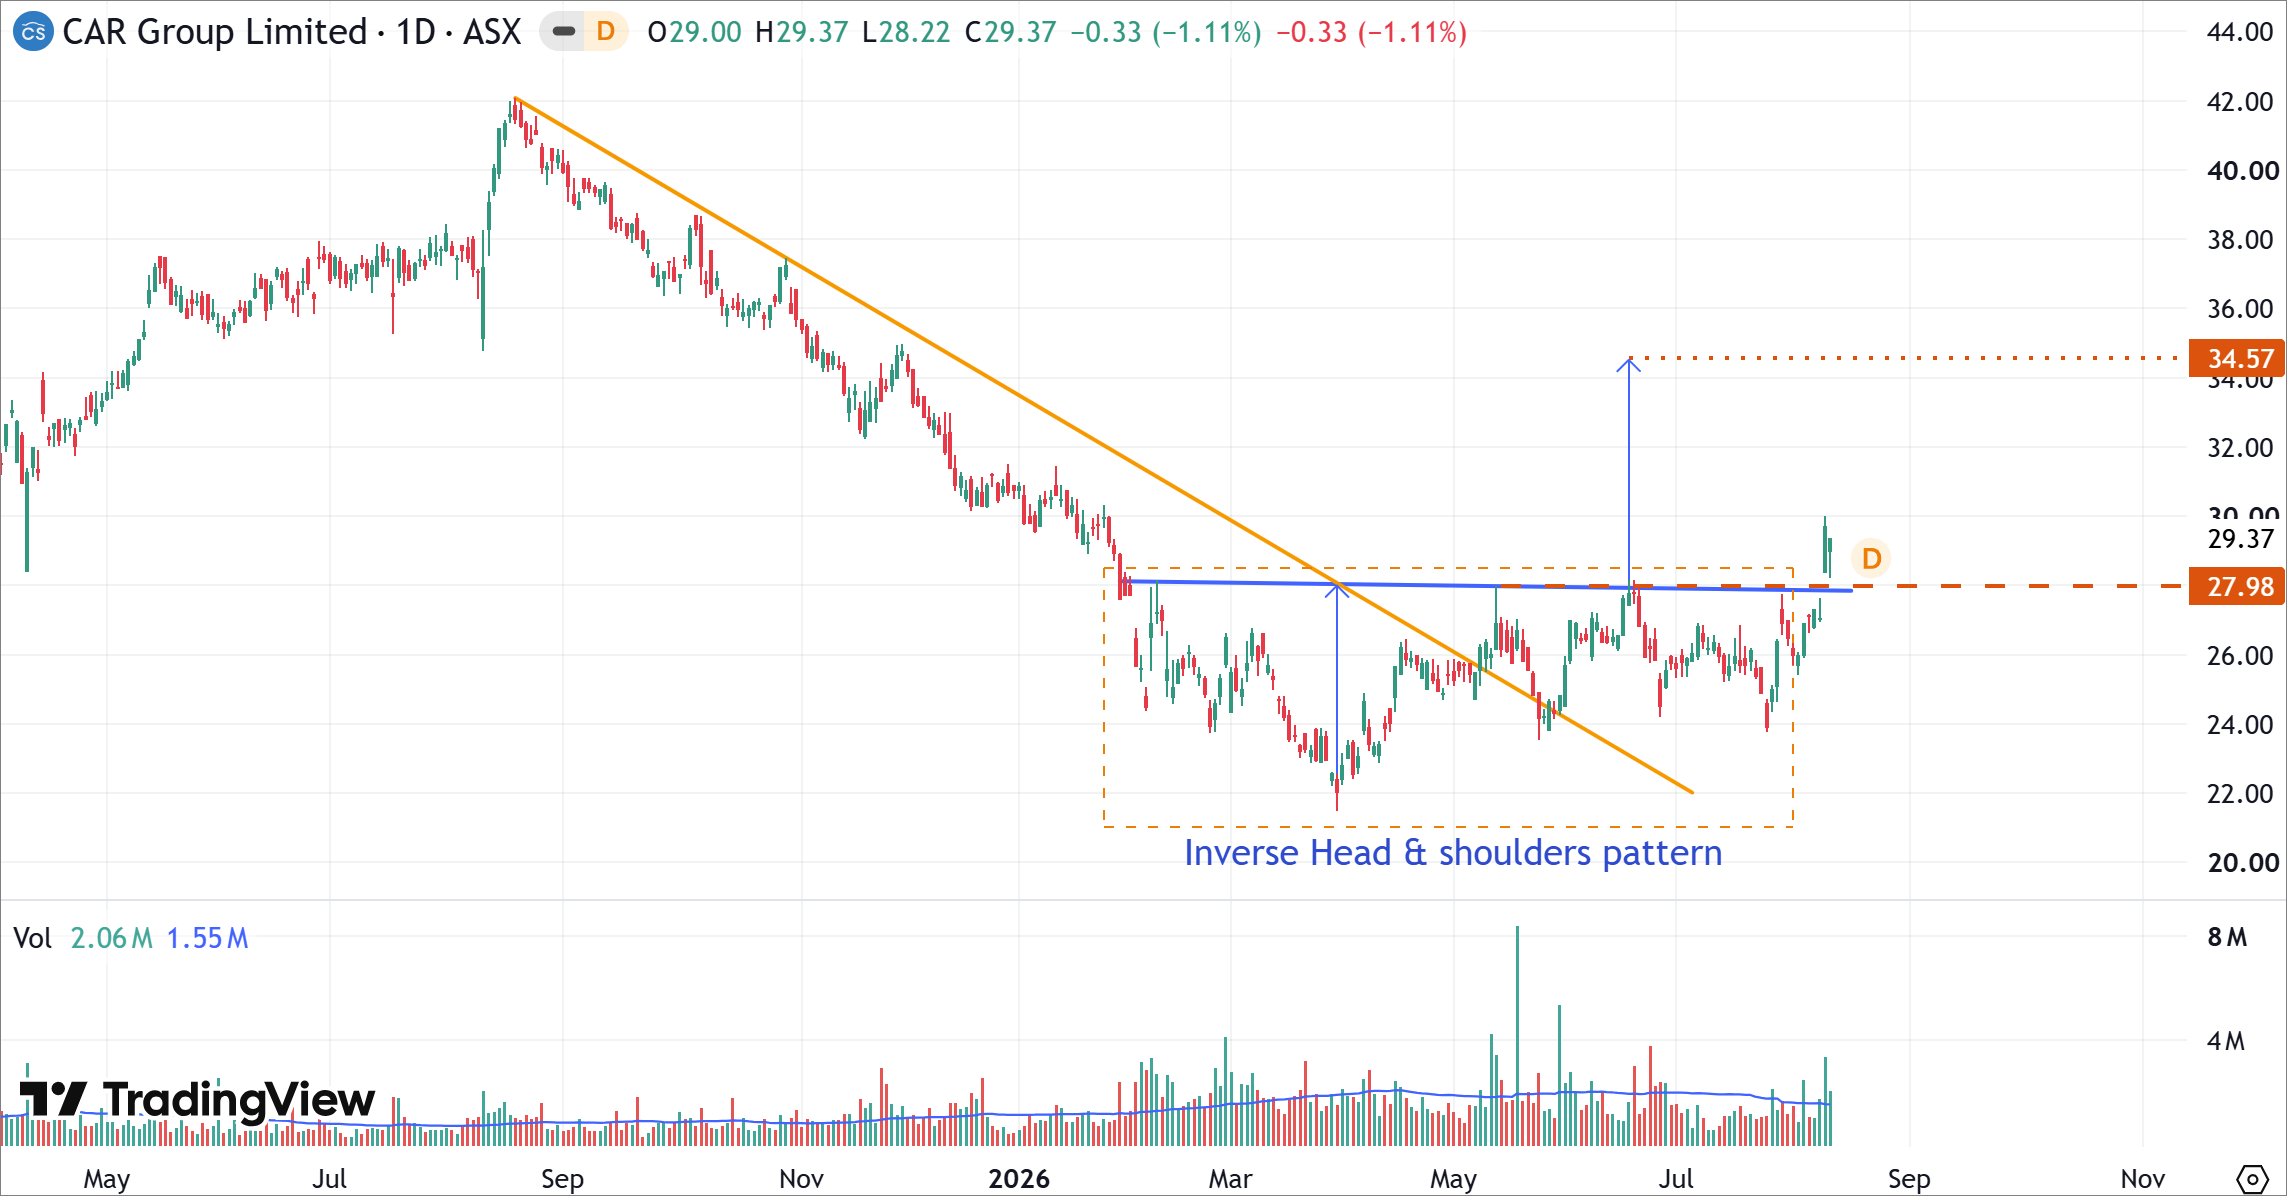
CAR's Daily Price Chart (at the closing price of 11/08/2026). Powered by: tradingview.com.
- CAR has completed an Inverse Head & Shoulders pattern following several months of consolidation after the significant decline from its 2025 peak. The structure suggests that the previous bearish trend has weakened and that buyers have gradually regained control.
- The stock has broken above the neckline around $27.98. The latest close of $29.37 places CAR comfortably above this important resistance level, strengthening the bullish technical structure.
- The breakout also moves CAR above the descending trendline extending from the previous major high. A simultaneous break of horizontal and dynamic resistance provides stronger confirmation of the potential trend reversal.
- The $27.98 area is now a key technical support level. Having acted as resistance during the formation of the pattern, this level could become support if the breakout is sustained.
- The measured-move projection indicates an upside objective of approximately $34.57. This represents potential upside of around 17.7% from the latest closing price of $29.37.
Bottom Line
CAR Group's strong FY2026 results, international growth and positive FY2027 guidance provide a supportive fundamental backdrop, with continued investment in AI and automotive technology offering additional Long-term Growth opportunities.
Technically, CAR has broken above the $27.98 neckline of a potential Inverse Head & Shoulders pattern. As long as the stock holds above this breakout zone, the bullish setup remains intact, with $34.57 representing the measured upside objective.


 Nov 12, 2026





 Please wait processing your request...