
 CA
 NZ
 UK
 US
 IND

 AU

 Share
 X (Formerly Twitter)
 Whatsapp
 Facebook
 LinkedIn
 Telegram
 Email This Article
 Copy Link
 Summarize with AI
 Chat GPT
 Perplexity

Key Highlights
- Bendigo & Adelaide Bank remains a key player in the Australian regional banking sector, characterized by high customer satisfaction but challenged by the immense scale of the "Big Four."
- The bank is actively navigating a highly competitive mortgage market and elevated funding costs, which continue to place structural pressure on its Net Interest Margins (NIM).
- The technical price action is flashing a severe warning sign, with the stock currently testing the neckline of a massive, multi-month Head & Shoulders distribution pattern.
While Bendigo & Adelaide Bank Limited (ASX:BEN) has historically been viewed as a reliable, yield-generating alternative to the major banks, the technical structure is currently painting a highly precarious picture. As the broader financial sector grapples with peak interest rates and fierce lending competition, BEN appears to be succumbing to a prolonged phase of institutional distribution. The stock is currently sitting at a make-or-break technical juncture, threatening to unleash a severe cyclical downtrend.
Margin Squeeze and Regional Pressures
BEN’s fundamental investment thesis is heavily anchored to its position as Australia's leading regional bank:
- Market Positioning: Bendigo boasts incredibly sticky retail deposits and industry-leading trust metrics. However, it lacks the sheer balance sheet scale and diversified institutional revenue streams of its larger peers, making it more sensitive to retail banking headwinds.
- Margin Compression: The intensely competitive domestic mortgage market, combined with higher wholesale funding costs, has systematically squeezed the bank's Net Interest Margin (NIM). This margin pressure directly impacts core profitability and limits upside earnings surprises.
- Dividend Yield: While the bank continues to offer an attractive dividend yield, the market is actively questioning the sustainability of dividend growth if the broader housing cycle cools or bad debt provisions need to be increased.
Associated Risks
The primary risk for Bendigo & Adelaide Bank is a deterioration in the domestic macroeconomic environment. Any significant uptick in unemployment or a protracted slowdown in the property market could lead to higher mortgage arrears and force the bank to increase its impairment charges. Furthermore, if the RBA maintains a "higher-for-longer" rate stance, the ongoing battle for retail deposits will continue to drag on the bank's cost of funding.
Technical Outlook
The daily chart for Bendigo & Adelaide Bank reveals a rapid deterioration in market structure, highlighting a textbook transition from a consolidation phase into a potential bearish freefall.
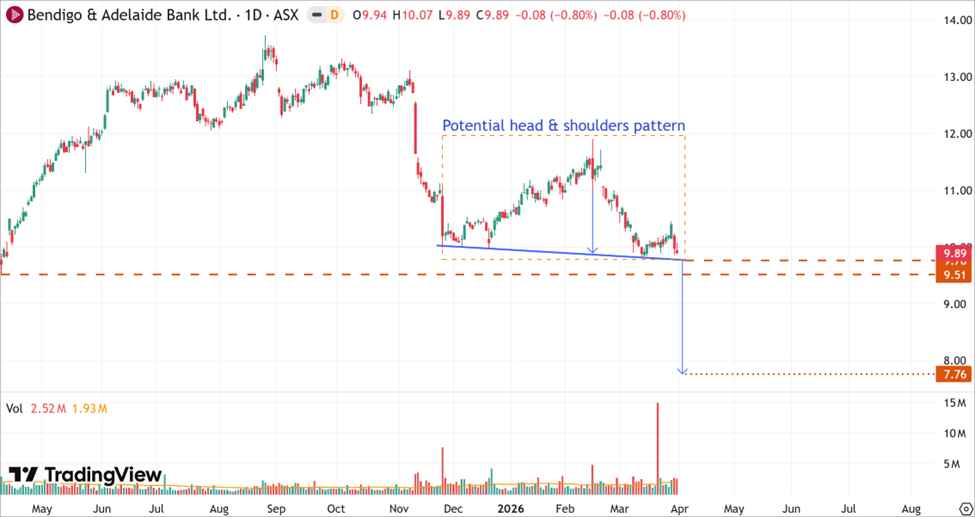
BEN’s Daily Price Chart (at the closing price of 31th March 2026). Powered by: tradingview.com
- Pattern Formation: High on the chart, BEN has carved out a massive Potential Head & Shoulders pattern spanning from late November 2025 through early April 2026. This prolonged formation highlights a complete exhaustion of buyer momentum following the heavy sell-off from its $13.00+ peaks.
- The Neckline Test: The most critical feature on the chart is the descending blue neckline connecting the pattern's troughs. The stock is currently trading incredibly heavy, closing down -0.80% at $9.89, which places it squarely on top of this dynamic support line.
- Volume Signatures: Notice the massive spike in trading volume during the formation of the "head" in late February and early March. This indicates a climax of activity where institutional sellers likely unloaded significant inventory into retail strength.
- Support Zones and Targets: If the price decisively breaks below this blue neckline, the stock faces immediate horizontal support bands at $9.70 and $9.51. However, a total structural failure opens the door to the pattern's full measured move, projecting a severe primary downside target of $7.76.
Bottom Line
Bendigo & Adelaide Bank (ASX:BEN) is currently staring down the barrel of a textbook structural breakdown. The stock is teetering exactly on the neckline of a massive Head & Shoulders pattern at $9.89. This is a definitive make-or-break moment. A decisive daily close below this blue trendline, particularly if it breaches the $9.51 horizontal safety net, would confirm a long-term bearish trend reversal. Investors and active traders should exercise extreme caution, as a confirmed breakdown heavily favors a continued descent toward the $7.76 technical target.


 Nov 12, 2026





 Please wait processing your request...