
 CA
 NZ
 UK
 US
 IND

 AU

 Share
 X (Formerly Twitter)
 Whatsapp
 Facebook
 LinkedIn
 Telegram
 Email This Article
 Copy Link
 Summarize with AI
 Chat GPT
 Perplexity

Highlights
- ACL has reported FY25 revenue of AUD 741.3 million, up 6.4% YoY.
- Statutory net profit after tax rose to AUD 32.8 million in FY25, reflecting a 35.4% YoY increase.
- The company announced a 12-month on-market share buyback program for 19.5 million shares.
Australian Clinical Labs Limited (ASX:ACL) is an Australian provider of pathology services operating across the country. The company’s NATA-accredited laboratories perform a range of tests for doctors, hospitals, patients, and corporate clients. It is one of the major private hospital pathology businesses in Australia.
Financial Update
For the financial year ended 30 June 2025 (FY25), the company reported total revenue of AUD 741.3 million, compared to AUD 696.4 million in FY24, reflecting a 6.4% YoY increase. In the same period, statutory net profit after tax (NPAT) was AUD 32.8 million, up from AUD 24.2 million in FY24, marking a 35.4% YoY rise. Free cash flow stood at AUD 70.8 million in FY25, compared with AUD 54.4 million in FY24, a 30.2% increase.
The rise in revenue was mainly due to higher MBS outlays and specialist testing volumes. Underlying EBIT increased by 8.7% YoY in FY25, driven by operational efficiencies such as labour optimisation and margin improvement.
Business Update
On 28 October 2025, Stephen Roche acquired 70,000 ordinary shares in ACL through an on-market transaction. No securities were sold, and the trade did not occur during a closed period.
On 23 October 2025, the company announced a plan to commence a 12-month on-market share buy-back program for up to 19.5 million shares, representing approximately 10% of its issued capital. The program, expected to begin around 12 November 2025, is intended to maintain a stable balance sheet and provide flexibility for capital management, with the timing and volume of buy-backs dependent on prevailing market conditions.
Key positive and Negatives
In FY25, the company recorded a gross margin of 82.7%, compared to the industry median of 16.9%. The net margin for the same period stood at 4.4%, higher than the industry median of 1.8%. On the other hand, the company reported a quick ratio of 0.48x, which is lower than the industry median of 1.07x in FY25. Additionally, the fixed asset turnover ratio was 2.69x in FY25, compared to the industry median of 10.73x.
Business Outlook
In FY26, ACL expects revenue in the range of AUD 760–780 million and EBIT of AUD 67–73 million, supported by strategic initiatives, digital billing improvements, and operational efficiencies. The company focuses on continued operational innovation through AI deployment, lab efficiency improvements, and digital workflows to enhance margin and patient outcomes.
Share Performance of ACL
ACL shares were trading at AUD 2.60 per share on 30 October 2025 with intraday loss of 1.14%. ACL’s stock has dropped by 5.79% in last three moth as well as down by 16.93% over the past six months, and down by 27.77% over the past year. ACL’s 52 week high is AUD 3.83, recorded on 04 February 2025 and 52-week low is AUD 2.3, recorded on 30 September 2025.
Support and Resistance Summary
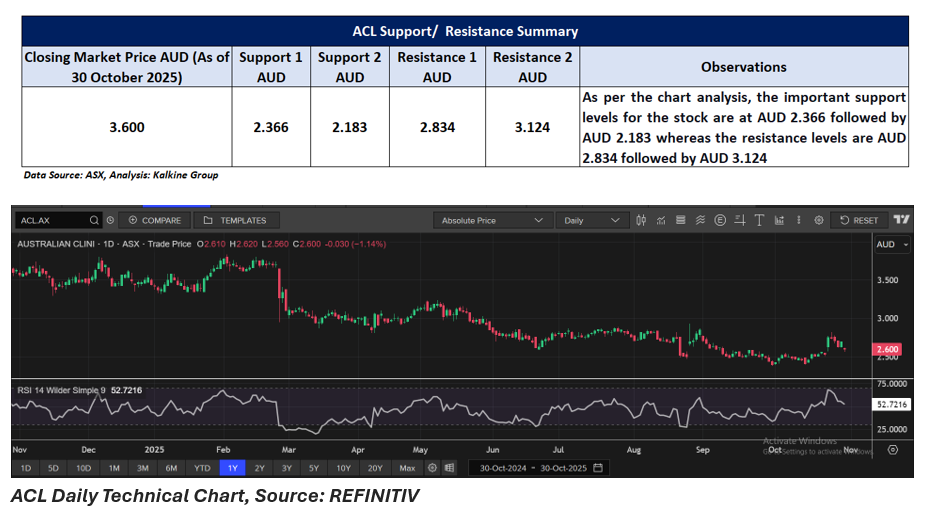
Note 1: Past performance is neither an Indicator nor a guarantee of future performance.
Note 2: The reference date for all price data, and currency, is 30 October 2025. The reference data in this report has been partly sourced from EODHD/Others.
Technical Indicators Defined:
Support: A level at which the stock prices tend to find support if they are falling, and a downtrend may take a pause backed by demand or buying interest. Support 1 refers to the nearby support level for the stock and if the price breaches the level, then Support 2 may act as the crucial support level for the stock.
Resistance: A level at which the stock prices tend to find resistance when they are rising, and an uptrend may take a pause due to profit booking or selling interest. Resistance 1 refers to the nearby resistance level for the stock and if the price surpasses the level, then Resistance 2 may act as the crucial resistance level for the stock.
Disclaimer
This article has been prepared by Kalkine Media, echoed on the website kalkinemedia.com/au and associated pages, based on the information obtained and collated from the subscription reports prepared by Kalkine Pty. Ltd. [ABN 34 154 808 312; AFSL no. 425376] on Kalkine.com.au (and associated pages). The principal purpose of the content is to provide factual information only for educational purposes. None of the content in this article, including any news, quotes, information, data, text, reports, ratings, opinions, images, photos, graphics, graphs, charts, animations, and video is or is intended to be, advisory in nature. The content does not contain or imply any recommendation or opinion intended to influence your financial decisions, including but not limited to, in respect of any particular security, transaction, or investment strategy, and must not be relied upon by you as such. The content is provided without any express or implied warranties of any kind. Kalkine Media, and its related bodies corporate, agents, and employees (Kalkine Group) cannot and do not warrant the accuracy, completeness, timeliness, merchantability, or fitness for a particular purpose of the content or the website, and to the extent permitted by law, Kalkine Group hereby disclaims any and all such express or implied warranties. Kalkine Group shall NOT be held liable for any investment or trading losses you may incur by using the information shared on our website.


 Nov 12, 2026





 Please wait processing your request...