
 CA
 NZ
 UK
 US
 IND

 AU

 Share
 X (Formerly Twitter)
 Whatsapp
 Facebook
 LinkedIn
 Telegram
 Email This Article
 Copy Link
 Summarize with AI
 Chat GPT
 Perplexity

Key Highlights
- Aussie Broadband Limited (ASX:ABB) has developed a prominent Head & Shoulders pattern following a strong medium-term recovery.
- The stock has broken below the key neckline around $4.53, weakening the recent bullish structure.
- ABB closed at $4.43, below the neckline and close to the lower boundary of the recent trading range.
- The chart identifies initial support around $4.24, while the measured downside objective from the Head & Shoulders formation is approximately $3.51.
- The latest decline was accompanied by stronger-than-average trading volume, providing confirmation of the bearish technical signal.
- The breakdown suggests that upward momentum has weakened and sellers are beginning to regain control.
After recovering strongly from its 2025 lows, Aussie Broadband Limited (ASX:ABB) has formed a sizeable Head & Shoulders pattern around the $5.50–$5.80 area. The latest decline has pushed the stock below the neckline around $4.53, signalling a deterioration in its medium-term technical structure.
The breakdown places greater focus on the $4.24 support level initially, followed by the measured downside objective near $3.51. Importantly, trading Volume increased to approximately 1.63 million shares, above the displayed average of around 939,000 shares, strengthening confirmation of the bearish move.
Strong Growth Fundamentals Provide a Longer-Term Backdrop
Aussie Broadband continues to expand its telecommunications business, supported by growth in broadband connections, mobile services and its Business, Enterprise & Government segment. The company reported FY26 Revenue of approximately $1.30 billion, up 9%, while underlying EBITDA increased 19.6% to $165.3 million.
The company's on-net broadband connections also increased substantially during FY26, while its NBN Market Share reached 12.1%. Management has additionally provided FY27 underlying EBITDA guidance of $205 million to $215 million, indicating continued Earnings growth.
These fundamental improvements provide a supportive longer-term backdrop for the company. However, the technical deterioration shown on the latest chart suggests that investors are currently placing greater emphasis on short- to medium-term price momentum.
The Head & Shoulders breakdown therefore warrants close monitoring, particularly because sustained trading below the neckline could signal a deeper correction despite the company's underlying growth trajectory.
Associated Risks
Despite Aussie Broadband's improving Business performance, several risks could affect the share price.
The most immediate concern is the Head & Shoulders breakdown. The stock has recently moved below its neckline around $4.53, meaning ABB would need to recover above this level to significantly weaken the bearish signal. A sustained recovery above the neckline could indicate that the breakdown has failed.
Conversely, continued trading below $4.53 would strengthen the bearish technical structure and increase the probability of a move towards the $4.24 support level and potentially the $3.51 measured target.
Another consideration is the sharp increase in trading volume accompanying the latest decline. With approximately 1.63 million shares traded against an average of around 939,000, the breakdown has stronger volume confirmation than a typical low-volume decline.
Technical Outlook
ABB's Daily Chart suggests that its strong medium-term recovery is losing momentum as the stock breaks below a prominent Head & Shoulders pattern.
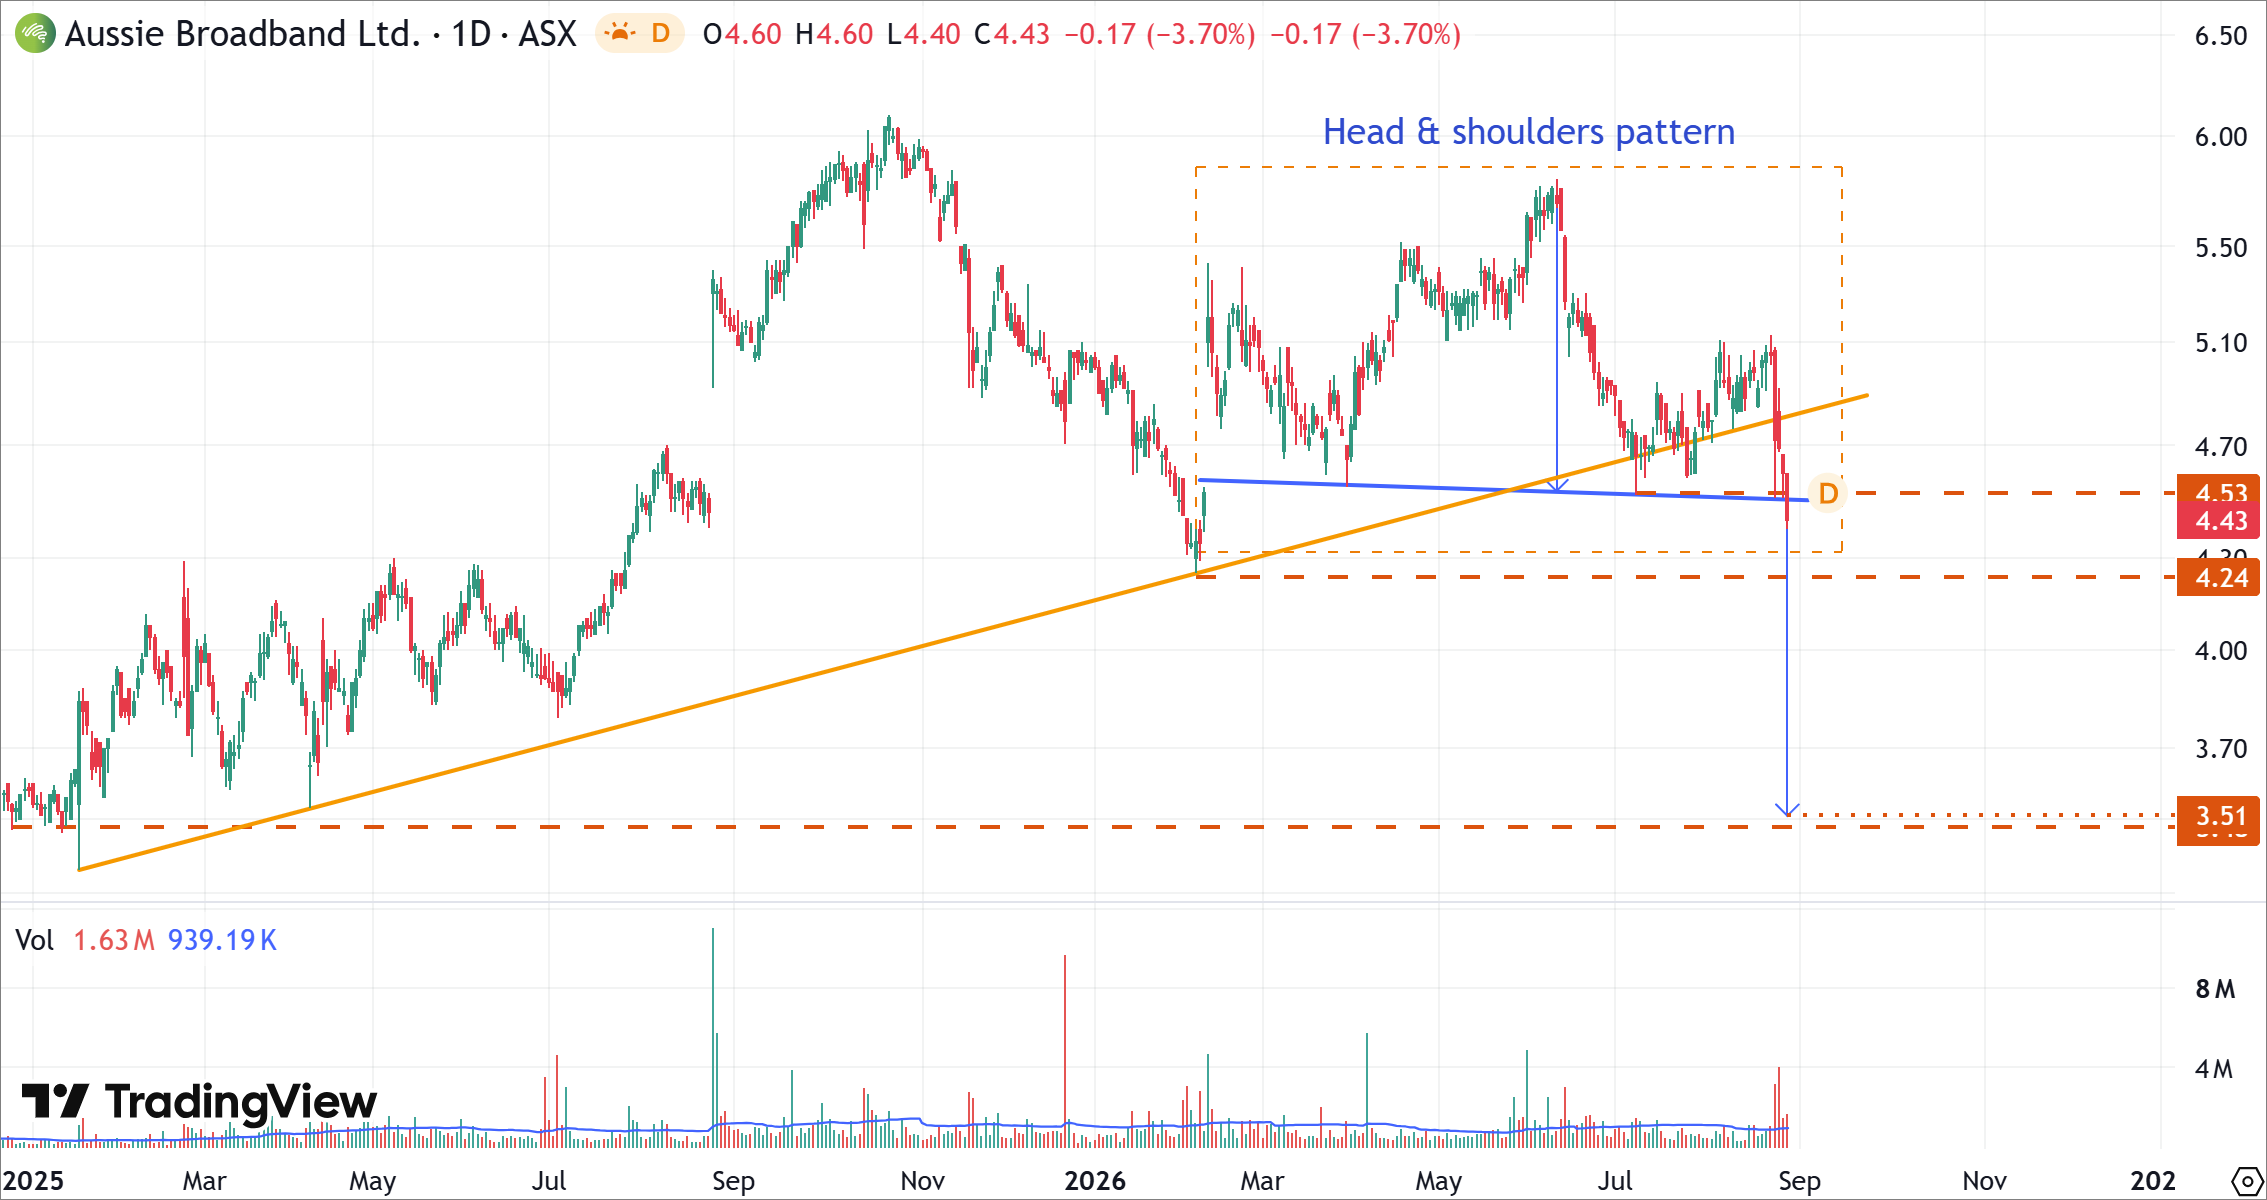
ABB's Daily Price Chart (at the closing price of 27/08/2026). Powered by: tradingview.com.
- ABB has developed a Head & Shoulders pattern following a substantial recovery from its 2025 lows. The formation indicates that upward momentum weakened around the $5.50–$5.80 region.
- The stock has broken below the neckline around $4.53, providing an initial bearish signal and weakening the previous bullish structure.
- The $4.24 level represents the next important support area shown on the chart. A sustained break below this level would further strengthen the bearish outlook.
- The measured-move projection from the Head & Shoulders formation points towards approximately $3.51, representing the major downside objective shown on the chart.
- Trading volume of approximately 1.63 million shares, compared with the displayed average of around 939,000, provides additional confirmation of the breakdown.
- A recovery above $4.53 would weaken the bearish setup, while sustained trading below the neckline would increase the likelihood of further downside.
Bottom Line
Aussie Broadband's strong revenue growth, expanding customer base and improving earnings provide a supportive longer-term fundamental backdrop. However, the latest price action indicates that short- to medium-term momentum has weakened considerably.
Technically, ABB has broken below the neckline of a prominent Head & Shoulders pattern around $4.53. The stock is now trading at $4.43, with $4.24 representing the next key support and $3.51 the major measured downside objective shown on the chart.
Unless ABB recovers back above the $4.53 neckline, the bearish setup remains intact and further downside risk should be considered.


 Nov 12, 2026





 Please wait processing your request...