
 CA
 NZ
 UK
 US
 IND

 AU

 Share
 X (Formerly Twitter)
 Whatsapp
 Facebook
 LinkedIn
 Telegram
 Email This Article
 Copy Link
 Summarize with AI
 Chat GPT
 Perplexity

Key Highlights
- Utilities (XUJ) occupies the strongest Leading position, with positive relative performance and momentum.
- Consumer Staples (XSJ), Consumer Discretionary (XDJ), Healthcare (XHJ), Energy (XEJ), Financials (XFJ) and Property (XPJ) also occupy Leading, although their relative strength and momentum trajectories vary.
- Communication Services (XTJ) is positioned in Improving, with momentum positive while relative performance remains negative.
- Industrials (XNJ) sits near the boundary between Improving and Lagging, making its next directional movement important for determining its quadrant status.
- Materials (XMJ), Resources (XJR) and Information Technology (XIJ) remain in Lagging, with negative relative performance and momentum.
- Information Technology shows the weakest momentum position, while Materials and Resources are also positioned deeply in the lower-left quadrant.
The Relative Performance Visualization dated 22 October 2026 presents a divided momentum picture across the supplied ASX sector indices. Utilities remains the clearest leader, joined by Consumer Staples, Consumer Discretionary, Healthcare, Energy, Financials and Property in the Leading quadrant. Communication Services occupies Improving, while Industrials is positioned close to the boundary between Improving and Lagging. Materials, Resources and Information Technology remain in Lagging. The chart's horizontal and vertical zero lines distinguish positive from negative readings across its two dimensions, while the plotted paths show how each sector has moved through the quadrants over the displayed periods. This analysis focuses exclusively on momentum positioning and relative performance rather than daily price returns or company news.
ASX Sector Momentum Quadrants Summary
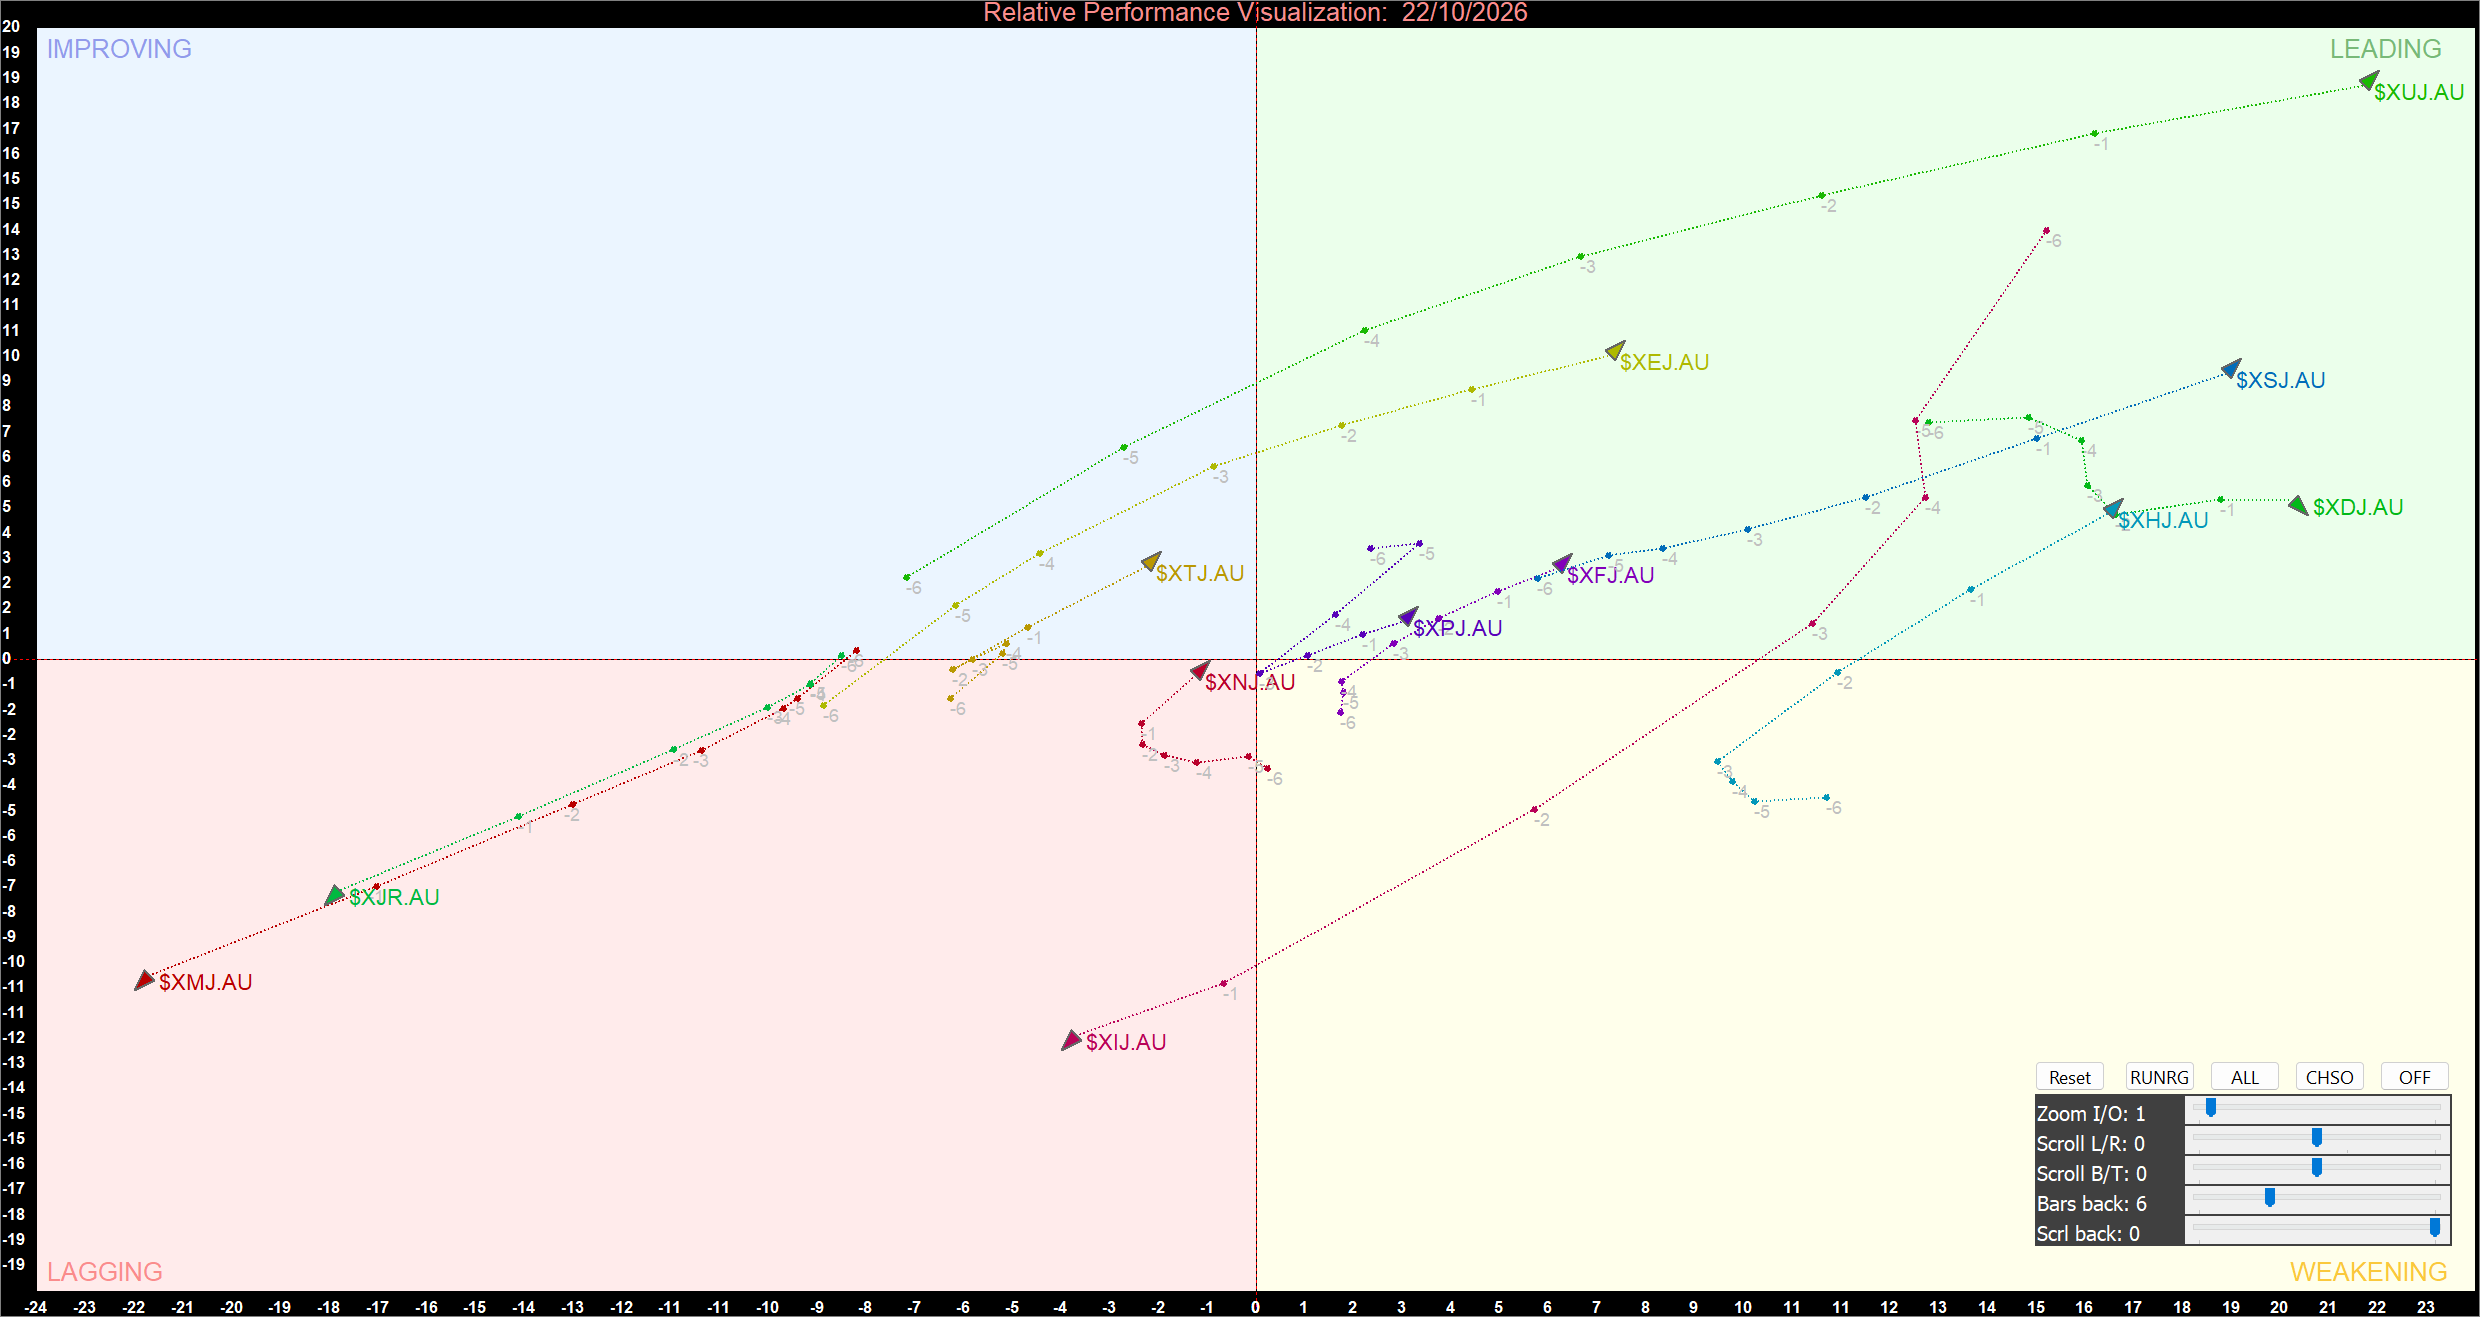
ASX Sector Relative Momentum Chart (at the closing price of 22/10/2026). Powered by: amibroker.com.
Leading Quadrant: Utilities and Selected Consumer Sectors
Utilities remains the clearest momentum leader on the chart. Its endpoint sits near the upper-right corner, indicating strongly positive readings for both relative performance and momentum. Its upward trajectory across the displayed observations reinforces its Leadership position. Energy is also firmly positioned in Leading, with positive readings on both dimensions, although its position is less extreme than Utilities. These placements indicate relative outperformance accompanied by positive momentum, but neither guarantees that leadership will persist.
Consumer Staples and Consumer Discretionary also occupy Leading. Consumer Staples remains well above the horizontal axis and to the right of the vertical axis, indicating positive relative performance and momentum. However, its plotted path shows fluctuations, making the direction of its latest movement important. Consumer Discretionary is positioned further to the right, reflecting strong relative performance, although its trajectory suggests some moderation in momentum. Continued movement towards the centre would Warrant attention because a loss of momentum can precede a quadrant transition.
Healthcare, Financials and Property are also positioned in Leading. Their endpoints remain above the horizontal axis and to the right of the vertical axis, but their positions are closer to the central region than Utilities. This indicates that leadership extends beyond a single sector, while the strength of relative momentum differs among the leaders. Subsequent movement will help establish whether these sectors maintain their positions or begin to approach the boundary with Improving.
Improving Quadrant: Communication Services
Communication Services is positioned in Improving, where momentum is positive but relative performance remains negative. This quadrant can indicate an early recovery in momentum before relative strength has fully turned positive. XTJ's endpoint sits above the horizontal axis but to the left of the vertical axis, consistent with improving momentum without confirmed relative outperformance.
A sustained move to the right would strengthen the case for a transition into Leading. Conversely, a decline towards the horizontal axis could indicate that the recovery is losing strength. The sector's trajectory therefore matters as much as its current quadrant classification. Until relative performance becomes positive, Communication Services remains in a recovery phase rather than established leadership.
Industrials Near the Improving–Lagging Boundary
Industrials is positioned close to the boundary between Improving and Lagging. Its endpoint lies near the horizontal axis and close to the vertical midpoint, making it one of the chart's more transitional sectors. This position suggests that its momentum and relative performance readings are close to the thresholds separating the quadrants.
A sustained move above the horizontal axis would strengthen its Improving classification, while a move below that boundary would place it in Lagging if relative performance remains negative. Movement towards the right would provide further evidence of improving relative strength. Because XNJ is close to the boundary, small changes in its plotted position could materially alter its classification.
Lagging Quadrant: Technology, Materials and Resources
Information Technology is the most conspicuous weak point on the chart. Its endpoint lies deep below the horizontal axis and to the left of the vertical axis, indicating substantially negative momentum and relative performance. Although its trajectory shows movement across the displayed observations, the latest position remains far from the positive-momentum region. A sustained upward move towards the origin would be an early indication of stabilisation, but a transition into Improving would require positive momentum.
Materials and Resources are also positioned deeply in Lagging. Both combine negative relative performance with negative momentum, indicating weakness across both chart dimensions. Their distance from the centre highlights the extent of their relative underperformance compared with sectors in Leading. A move towards the origin would suggest that weakness is moderating, but it would not, by itself, confirm a reversal.
Sectors in Lagging generally need to improve momentum before establishing stronger relative performance. A sustained move above the horizontal axis would be an important first signal, followed by a move to the right of the vertical axis to confirm a transition into Leading. Until such changes occur, Technology, Materials and Resources remain the weakest group in the current configuration.
Bottom Line
The 22 October 2026 momentum chart identifies Utilities as the strongest leader, with Consumer Staples, Consumer Discretionary, Healthcare, Energy, Financials and Property also in Leading. Communication Services remains in Improving, while Industrials sits near the boundary between Improving and Lagging. Materials, Resources and Information Technology remain in Lagging, with Technology showing the weakest momentum position. The central distinction is between sectors with positive readings on both chart dimensions and those still below both zero lines. Subsequent quadrant movement will determine whether current leadership persists, whether Communication Services and Industrials improve further, and whether the lagging sectors begin a sustained recovery.


 Nov 12, 2026





 Please wait processing your request...