
 CA
 NZ
 UK
 US
 IND

 AU

 Share
 X (Formerly Twitter)
 Whatsapp
 Facebook
 LinkedIn
 Telegram
 Email This Article
 Copy Link
 Summarize with AI
 Chat GPT
 Perplexity

Key Momentum Shifts
- Utilities Maintains Clear Leadership: Utilities (ASX) occupies the strongest Leading position, with its endpoint far into the upper-right quadrant.
- Consumer Staples Retains Strong Relative Momentum: Consumer Staples (ASX) remains firmly in Leading, demonstrating a strong relative position despite changes along its plotted trajectory.
- Leadership Broadens Across Nine Sectors: Consumer Discretionary (ASX), Healthcare (ASX), Energy (ASX), Communication Services (ASX), Financials (ASX), Industrials (ASX) and Property (ASX) also occupy Leading.
- Industrials and Property Sit Near the Central Boundary: Both sectors have entered Leading but remain close to the quadrant origin, making their subsequent trajectories important for confirming sustained leadership.
- Materials and Resources Remain Deep in Lagging: Materials (ASX) and Resources (ASX) occupy substantially negative positions, indicating persistent relative weakness.
- Information Technology Remains a Significant Laggard: Information Technology (ASX) is positioned deep in the lower-left quadrant, well below the horizontal midpoint.
The latest Relative Performance Visualization for 23 October 2026 shows a broad concentration of ASX sectors in the Leading quadrant. Nine sectors occupy the upper-right region, while Materials, Resources and Information Technology remain in Lagging. No sector is clearly positioned in either Improving or Weakening at the latest plotted endpoints.
The chart indicates that positive relative momentum is widespread across the sector group, although the strength of individual positions varies considerably. Utilities stands out as the clearest leader, while Consumer Staples also maintains a strong position. By contrast, Materials and Resources remain substantially separated from the leading group. This analysis focuses on quadrant positioning and momentum trajectories rather than daily price performance or company-specific developments.
Momentum Breakdown by Quadrant
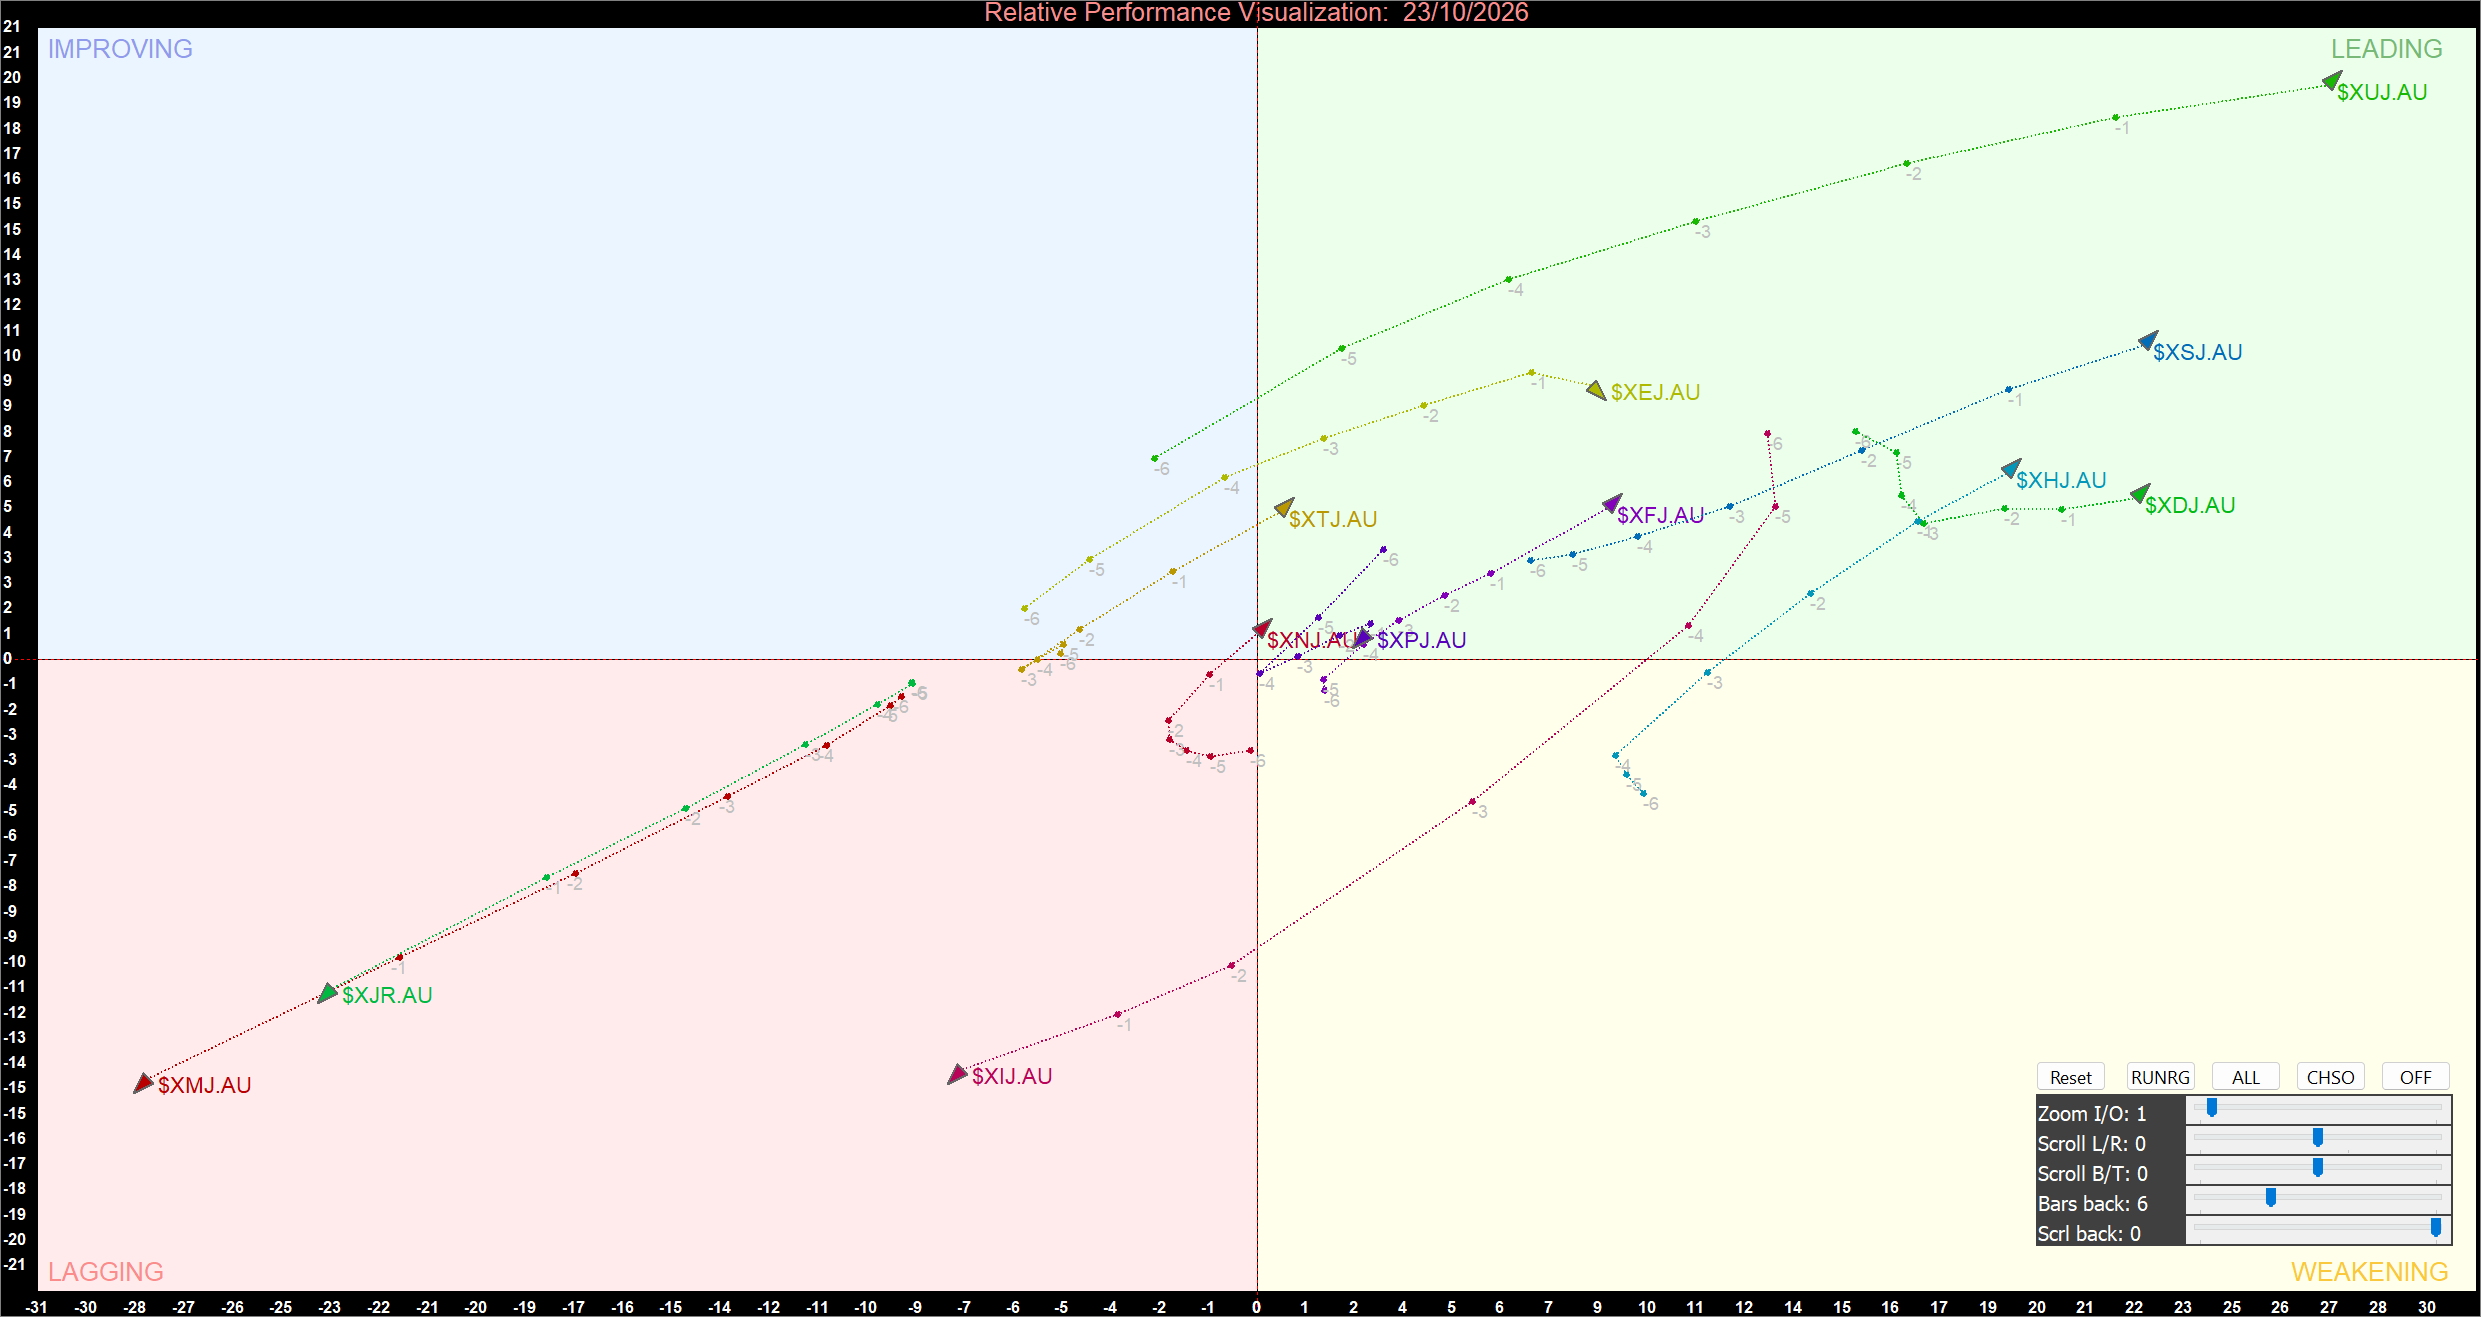
ASX Sector Relative Momentum Chart (at the closing price of 23/10/2026). Powered by: amibroker.com.
Leading Quadrant
Utilities (ASX), Consumer Staples (ASX), Consumer Discretionary (ASX), Healthcare (ASX), Energy (ASX), Communication Services (ASX), Financials (ASX), Industrials (ASX) and Property (ASX) occupy the Leading quadrant. Their latest plotted positions are above the horizontal midpoint and to the right of the vertical axis, indicating positive relative performance and momentum.
Utilities maintains the strongest position, with its endpoint located furthest to the right and near the top of the chart. Its trajectory shows a substantial movement through the upper-right region, reinforcing its status as the clearest relative-momentum leader. Consumer Staples also occupies a well-established Leading position, although its plotted path shows changes in direction that Warrant monitoring.
Consumer Discretionary and Healthcare remain in Leading, with both sectors positioned comfortably within the positive region. Energy also maintains a positive relative-momentum position. These sectors contribute to the breadth of leadership, showing that positive momentum extends across consumer, healthcare and energy exposures rather than being concentrated in a single area.
Financials and Communication Services are also in Leading, but their endpoints are closer to the centre than those of Utilities and Consumer Staples. This difference matters because quadrant membership alone does not establish that all leading sectors have equally strong momentum. Their subsequent direction of movement will help determine whether their relative positions strengthen or begin to moderate.
Industrials and Property sit close to the central boundary while remaining in Leading. Their positive positioning indicates that both have crossed into the upper-right quadrant, but their proximity to the origin makes them less established leaders than sectors positioned further to the right. Sustained movement away from the central boundary would provide stronger confirmation of improving relative strength.
Improving Quadrant
No sector is clearly positioned in the Improving quadrant at the latest plotted endpoints. This quadrant represents sectors with positive momentum readings but negative relative performance, located above the horizontal axis and to the left of the vertical midpoint.
The absence of a clearly established sector in Improving suggests that the current chart is concentrated in Leading and Lagging rather than showing a distinct group transitioning upward from relative weakness. Future movement toward the upper-left quadrant would indicate that a sector's momentum had improved before its relative performance returned to positive territory.
Weakening Quadrant
No sector is clearly positioned in Weakening at the latest plotted endpoints. This quadrant typically contains sectors that retain positive relative performance but have negative momentum, placing them below the horizontal axis and to the right of the vertical midpoint.
Although some sectors in Leading display changes in their plotted trajectories, their latest endpoints remain above the horizontal midpoint. Their current classification therefore remains Leading. Subsequent downward movement toward the horizontal axis would be an early sign of weakening momentum, but a sustained move below it would be needed to establish a transition into Weakening.
Technology, Materials and Resources Remain in Lagging
Information Technology (ASX), Materials (ASX) and Resources (ASX) remain in the Lagging quadrant. Their endpoints are below the horizontal midpoint and to the left of the vertical axis, indicating negative readings on both dimensions.
Materials and Resources are positioned particularly far to the left, highlighting their substantial relative weakness compared with the leading sectors. Information Technology also remains deeply negative, with its endpoint well below the horizontal midpoint. Although the plotted paths show movement over the observation period, the latest positions have not produced a transition into Improving.
A sustained upward movement toward the horizontal axis would be necessary to signal an initial recovery in momentum. Movement above that axis, followed by a move to the right of the vertical midpoint, would provide stronger evidence of a transition from Lagging through Improving toward Leading.
Strategic Summary
The 23 October 2026 chart presents a sharply divided relative-momentum structure. Nine sectors occupy Leading, with Utilities maintaining the strongest position and Consumer Staples also displaying established leadership. Consumer Discretionary, Healthcare, Energy, Communication Services, Financials, Industrials and Property complete the Leading group, although Industrials and Property remain close to the central boundary.
Materials, Resources and Information Technology remain the principal laggards, with deeply negative relative positions. The next important signals will be whether Industrials and Property move further into Leading, whether established leaders sustain their positive momentum, and whether the lagging sectors recover toward the horizontal midpoint. Overall, Leadership is broad, but the separation between the leading sectors and the three laggards remains pronounced.


 Nov 12, 2026





 Please wait processing your request...