
 CA
 NZ
 UK
 US
 IND

 AU

 Share
 X (Formerly Twitter)
 Whatsapp
 Facebook
 LinkedIn
 Telegram
 Email This Article
 Copy Link
 Summarize with AI
 Chat GPT
 Perplexity

Key Momentum Shifts
- Utilities Maintains Clear Leadership: Utilities (ASX:XUJ) remains well separated from the other sectors in the upper-right quadrant, although its trail has turned down from a recent peak.
- Five Sectors Occupy Leading: Financials (ASX:XFJ), Healthcare (ASX:XHJ), Communication Services (ASX:XTJ) and Industrials (ASX:XNJ) join Utilities in Leading.
- Four Sectors Sit in Weakening: Consumer Discretionary (ASX:XDJ), Consumer Staples (ASX:XSJ), Energy (ASX:XEJ) and Real Estate (ASX:XPJ) are below the horizontal midpoint while remaining to the right of the vertical axis.
- Three Sectors Remain in Lagging: Resources (ASX:XJR), Materials (ASX:XMJ) and Information Technology (ASX:XIJ) remain in the lower-left quadrant.
- No Sector Is Clearly Improving: No plotted sector endpoint is clearly positioned in the upper-left quadrant, leaving the rotation picture concentrated in Leading, Weakening and Lagging.
The Relative Performance Visualization for 30 October 2026 shows a more divided momentum picture than a broad-based Leading configuration. Utilities remains the standout by relative position, with Financials, Healthcare, Communication Services and Industrials also in Leading. Consumer Discretionary, Consumer Staples, Energy and Real Estate occupy Weakening, while Resources, Materials and Information Technology remain in Lagging. No sector endpoint is clearly in Improving.
Momentum Breakdown by Quadrant
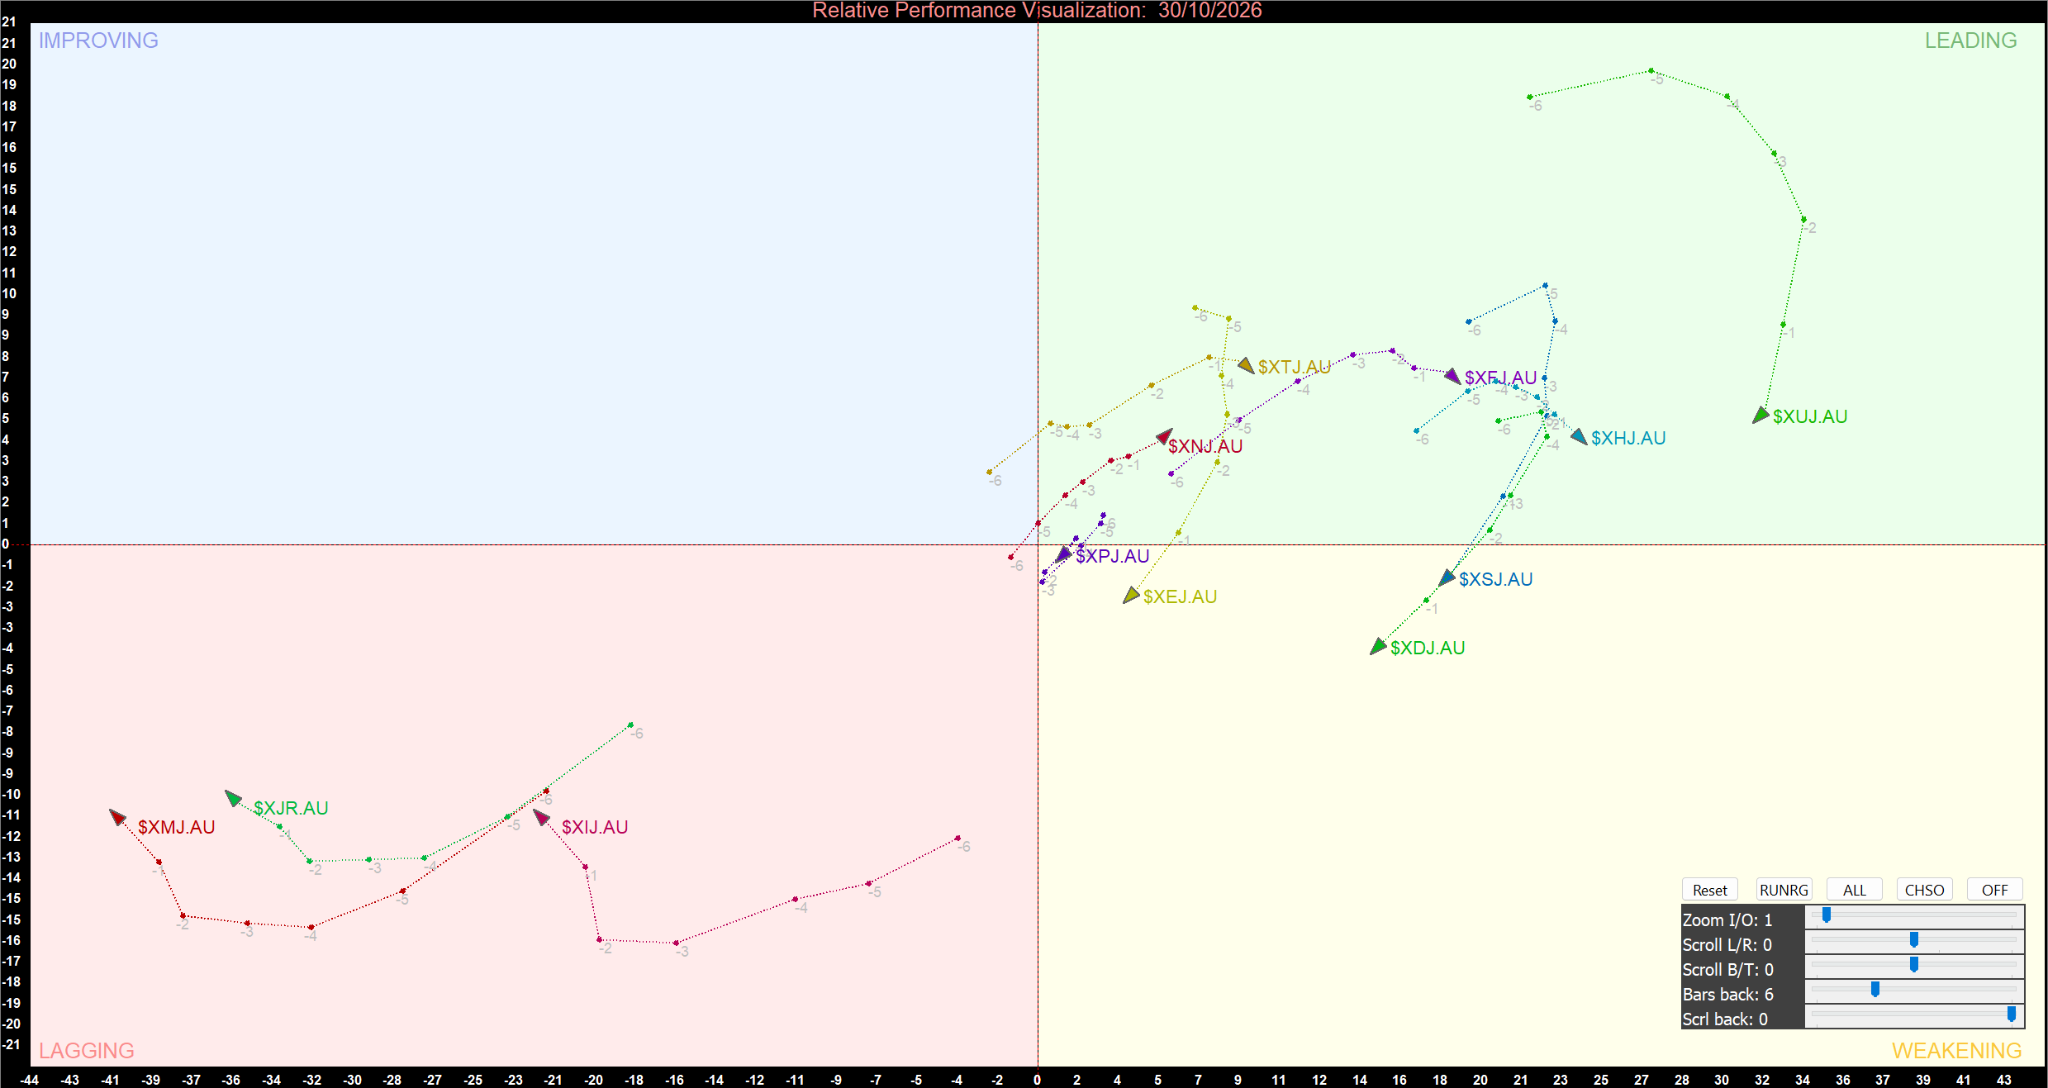
ASX Sector Relative Momentum Chart (at the closing price of 30/10/2026). Powered by: amibroker.com.
Leading Quadrant
Utilities (ASX:XUJ), Financials (ASX:XFJ), Healthcare (ASX:XHJ), Communication Services (ASX:XTJ) and Industrials (ASX:XNJ) occupy the Leading quadrant. Their endpoints sit above the horizontal midpoint and to the right of the vertical axis, indicating positive readings across both relative dimensions. Utilities is furthest to the right and remains distinctly separated from the rest of the group, giving it the clearest relative-momentum Leadership on the chart.
The Leading group is not moving uniformly. Utilities remains strongly positioned but has turned down from its recent high, suggesting that its relative momentum may be moderating. Financials and Communication Services sit in the upper-right area but closer to the central cluster. Healthcare is also positive, though its recent trail suggests a retreat from earlier momentum levels. Industrials is nearer the central boundary, making its Leading status less pronounced than Utilities. The current quadrant locations are positive, but the direction of each trail remains important when assessing whether leadership is strengthening or fading.
Four Sectors Move into Weakening
Consumer Discretionary (ASX:XDJ), Consumer Staples (ASX:XSJ), Energy (ASX:XEJ) and Real Estate (ASX:XPJ) are positioned below the horizontal midpoint while remaining to the right of the vertical axis. This configuration indicates that their horizontal relative-performance readings remain positive, but their vertical momentum readings have slipped below the midpoint. They are therefore not yet in the same quadrant as the Lagging sectors, although the chart signals that momentum has weakened relative to the Leading group.
Consumer Discretionary is the most visibly weak of these four by vertical position, sitting well below the horizontal axis. Consumer Staples is also below the midpoint, while Energy is closer to the centre and Real Estate lies near the quadrant boundary. A move back above the horizontal midpoint, while remaining to the right of the vertical axis, would be needed for any of these sectors to return to Leading. Further downward movement would reinforce their Weakening classification. The latest endpoints, rather than earlier trail positions, determine the current quadrant assignments.
Resources, Materials and Technology Remain in Lagging
Resources (ASX:XJR), Materials (ASX:XMJ) and Information Technology (ASX:XIJ) remain in Lagging, with their endpoints below the horizontal midpoint and left of the vertical axis. Materials and Resources are positioned deep in the lower-left region, reflecting pronounced weakness across both relative dimensions. Information Technology also remains well inside Lagging, although its endpoint is somewhat closer to the centre than the most deeply positioned resource-related sectors.
The trails of Resources and Materials show some recovery from earlier lows, but their latest positions have not crossed into Improving. A sustained upward move toward and above the horizontal midpoint would be an initial indication of momentum recovery; movement to the right of the vertical axis would also be needed to confirm a shift into a stronger relative-performance quadrant. Until then, the chart continues to classify these sectors as laggards. Information Technology’s position likewise indicates that a meaningful recovery has yet to be confirmed.
Strategic Summary
The 30 October 2026 chart identifies Utilities as the clearest relative-momentum leader, with Financials, Healthcare, Communication Services and Industrials also in Leading. Consumer Discretionary, Consumer Staples, Energy and Real Estate are in Weakening, while Resources, Materials and Information Technology remain in Lagging. No sector is clearly in Improving. The main momentum signals to monitor are whether Utilities stabilises after its pullback, whether the other Leading sectors sustain their positive positioning, whether the four Weakening sectors can recover above the horizontal midpoint, and whether the Lagging group continues moving toward the chart’s centre. This analysis focuses exclusively on quadrant positioning and momentum trajectories rather than daily price performance or company-specific developments.


 Nov 12, 2026





 Please wait processing your request...