
 CA
 NZ
 UK
 US
 IND

 AU

 Share
 X (Formerly Twitter)
 Whatsapp
 Facebook
 LinkedIn
 Telegram
 Email This Article
 Copy Link
 Summarize with AI
 Chat GPT
 Perplexity

Key Momentum Shifts
- Utilities (ASX:XUJ) retains a strong Leading position, with a pronounced upward trajectory.
- Real Estate (ASX:XPJ) has entered Leading, indicating positive relative strength and momentum.
- Information Technology (ASX:XIJ) has moved into Weakening, suggesting momentum has deteriorated despite its relative-strength position.
- Materials (ASX:XMJ) and Resources (ASX:XJR) remain in Lagging, reflecting continued relative weakness.
- No sector occupies Improving, leaving the chart split between Leading, Weakening and Lagging.
- Daily sector returns and RRG positioning differ: Consumer Staples gained 1.14%, while Energy fell 1.31% despite its position in Leading.
The Relative Rotation Graph for 20 October 2026 shows a divided picture across Australian sectors. Utilities, Energy, Financials, Consumer Staples, Consumer Discretionary and Real Estate occupy Leading. Healthcare and Information Technology are in Weakening, while Materials, Resources, Industrials and Communication Services remain in Lagging. No sector is currently in Improving. Utilities has the strongest upward trajectory among the leaders, while the movement of Real Estate into Leading marks a notable shift from its previous weaker position.
The chart should be interpreted independently of single-session returns. Consumer Staples recorded the strongest daily gain in the supplied performance data, rising 1.14%, while Healthcare advanced 0.87% and Consumer Discretionary gained 0.76%. Energy, however, fell 1.31% on the day even though its relative rotation position is in Leading. This divergence demonstrates that quadrant Placement reflects relative strength and momentum over the chart’s lookback, not simply the latest daily return.
Momentum Breakdown by Quadrant
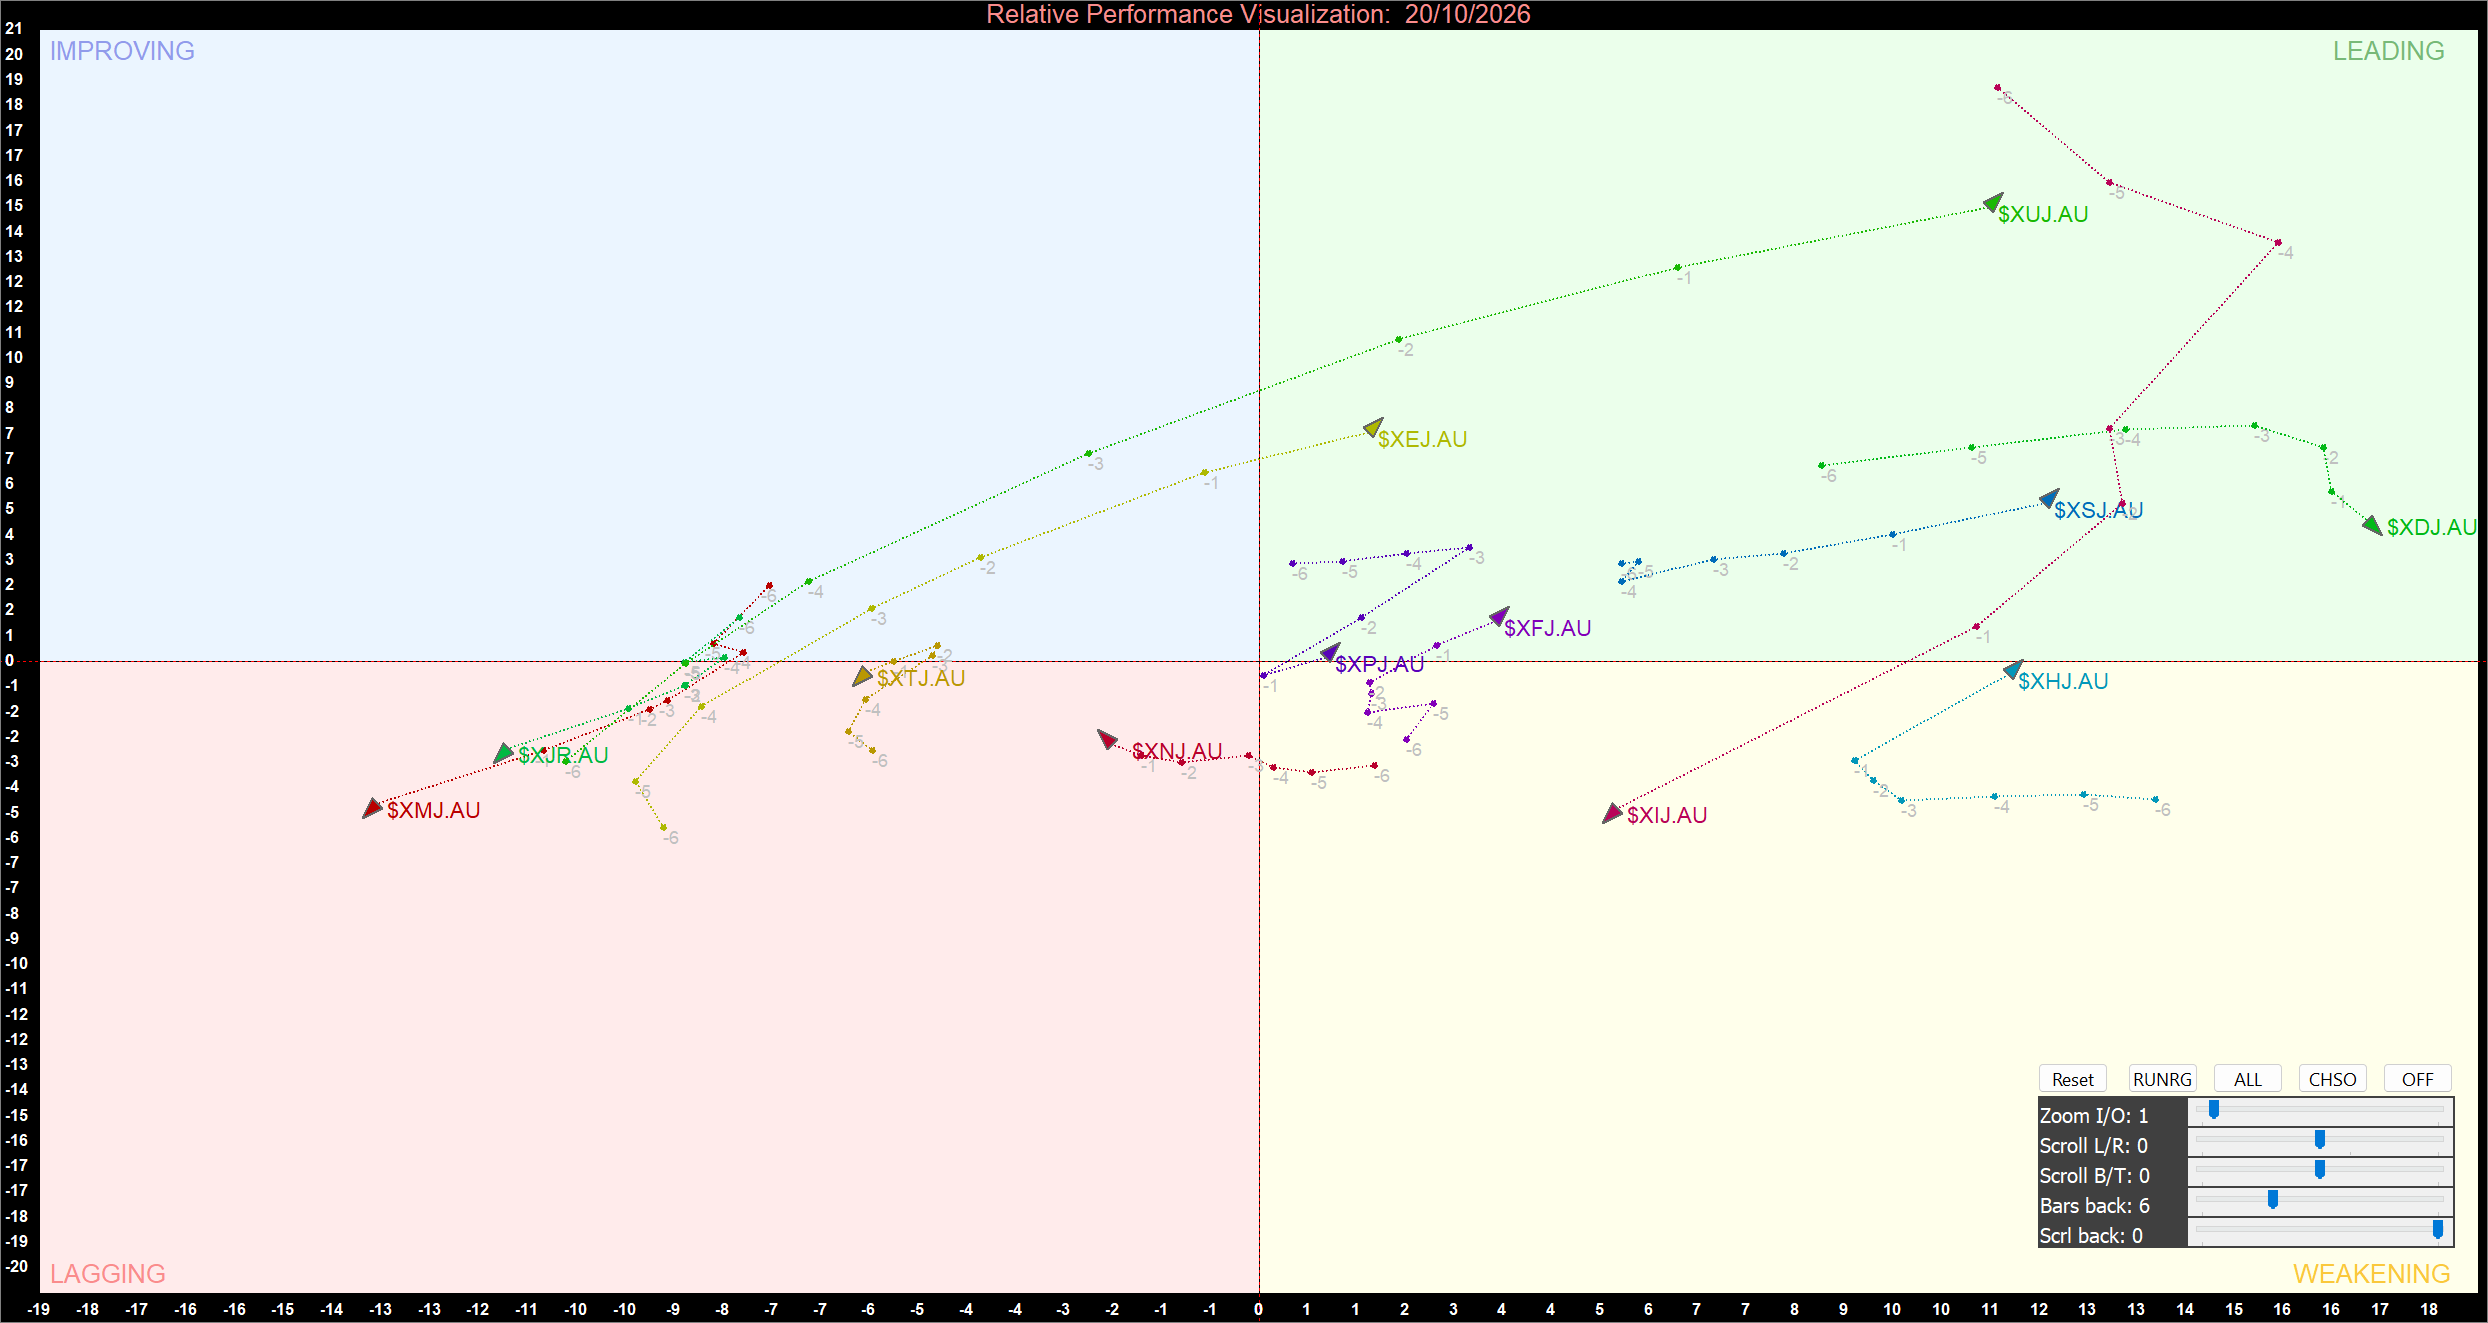
ASX Sector Relative Momentum Chart (at the closing price of 20/10/2026). Powered by: amibroker.com.
Leading Quadrant
Utilities (ASX:XUJ), Energy (ASX:XEJ), Financials (ASX:XFJ), Consumer Staples (ASX:XSJ), Consumer Discretionary (ASX:XDJ) and Real Estate (ASX:XPJ) occupy Leading. Their positions indicate positive relative strength and momentum against the broader market. Utilities remains particularly strong, while Real Estate’s entry into the quadrant suggests its relative trend has improved. Continued positive trajectories would help confirm leadership; a downward turn could signal weakening momentum.
Weakening Quadrant
Information Technology (ASX:XIJ) and Healthcare (ASX:XHJ) are in Weakening. These sectors retain relative strength above the vertical threshold but have negative momentum below the horizontal midpoint. Information Technology’s position is especially worth monitoring: a continued decline could undermine relative strength, while a renewed upward turn would suggest momentum is stabilising.
Lagging Quadrant
Materials (ASX:XMJ), Resources (ASX:XJR), Industrials (ASX:XNJ) and Communication Services (ASX:XTJ) remain in Lagging, indicating weak relative strength and momentum. Materials and Resources are positioned well within the weaker region, so a sustained upward trajectory towards Improving would be needed before a recovery could be considered established. Short-term price gains alone would not confirm a quadrant transition.
Bottom Line
The 20 October 2026 RRG shows Utilities maintaining Leadership and Real Estate moving into Leading, while Information Technology has shifted into Weakening. Materials, Resources, Industrials and Communication Services remain in Lagging, and no sector occupies Improving. Investors should watch whether the leaders sustain their positive trajectories and whether the lagging sectors begin a durable move towards improving relative momentum. The chart’s quadrant signals should be considered alongside, rather than replaced by, daily price performance.


 Nov 12, 2026





 Please wait processing your request...