
 CA
 NZ
 UK
 US
 IND

 AU

 Share
 X (Formerly Twitter)
 Whatsapp
 Facebook
 LinkedIn
 Telegram
 Email This Article
 Copy Link
 Summarize with AI
 Chat GPT
 Perplexity

Key Momentum Shifts
- Technology Remains Leading but Momentum Weakens: Information Technology (ASX:XIJ) occupies Leading, although its recent trajectory points downward, suggesting a loss of relative momentum.
- Utilities Maintain Strong Momentum: Utilities (ASX:XUJ) remain firmly positioned in Leading, with a strong upward trajectory indicating sustained relative strength.
- Consumer Discretionary Retains Leadership: Consumer Discretionary (ASX:XDJ) remains in Leading, although its latest trajectory indicates some moderation in momentum.
- Energy and Communication Services Improve: Energy (ASX:XEJ) and Communication Services (ASX:XTJ) occupy Improving, reflecting positive momentum readings despite weaker relative strength.
- Financials and Healthcare Remain Weakening: Financials (ASX:XFJ) and Healthcare (ASX:XHJ) remain in Weakening, with positive relative strength but negative momentum.
- Materials, Resources and Industrials Lag: Materials (ASX:XMJ), Resources (ASX:XJR) and Industrials (ASX:XNJ) remain in Lagging, indicating persistent relative weakness.
The latest Relative Rotation Graph for 16 October 2026 shows continued divergence across ASX sector momentum. Utilities, Consumer Discretionary, Information Technology, Consumer Staples and Real Estate occupy the Leading quadrant. Energy and Communication Services are positioned in Improving, while Financials and Healthcare remain in Weakening. Materials, Resources and Industrials occupy Lagging. The chart highlights the strong position of Utilities and Consumer Discretionary, while Information Technology's downward trajectory warrants attention despite its position in Leading.
The chart also demonstrates that daily price performance and broader relative momentum can diverge significantly. Information Technology recorded a strong daily gain of 5.62% but displayed a weakening trajectory within Leading. Materials and Resources also advanced strongly, gaining 3.18% and 2.65%, respectively, while remaining in Lagging. These differences reinforce the importance of evaluating momentum direction and quadrant position separately from individual session returns.
Momentum Breakdown by Quadrant
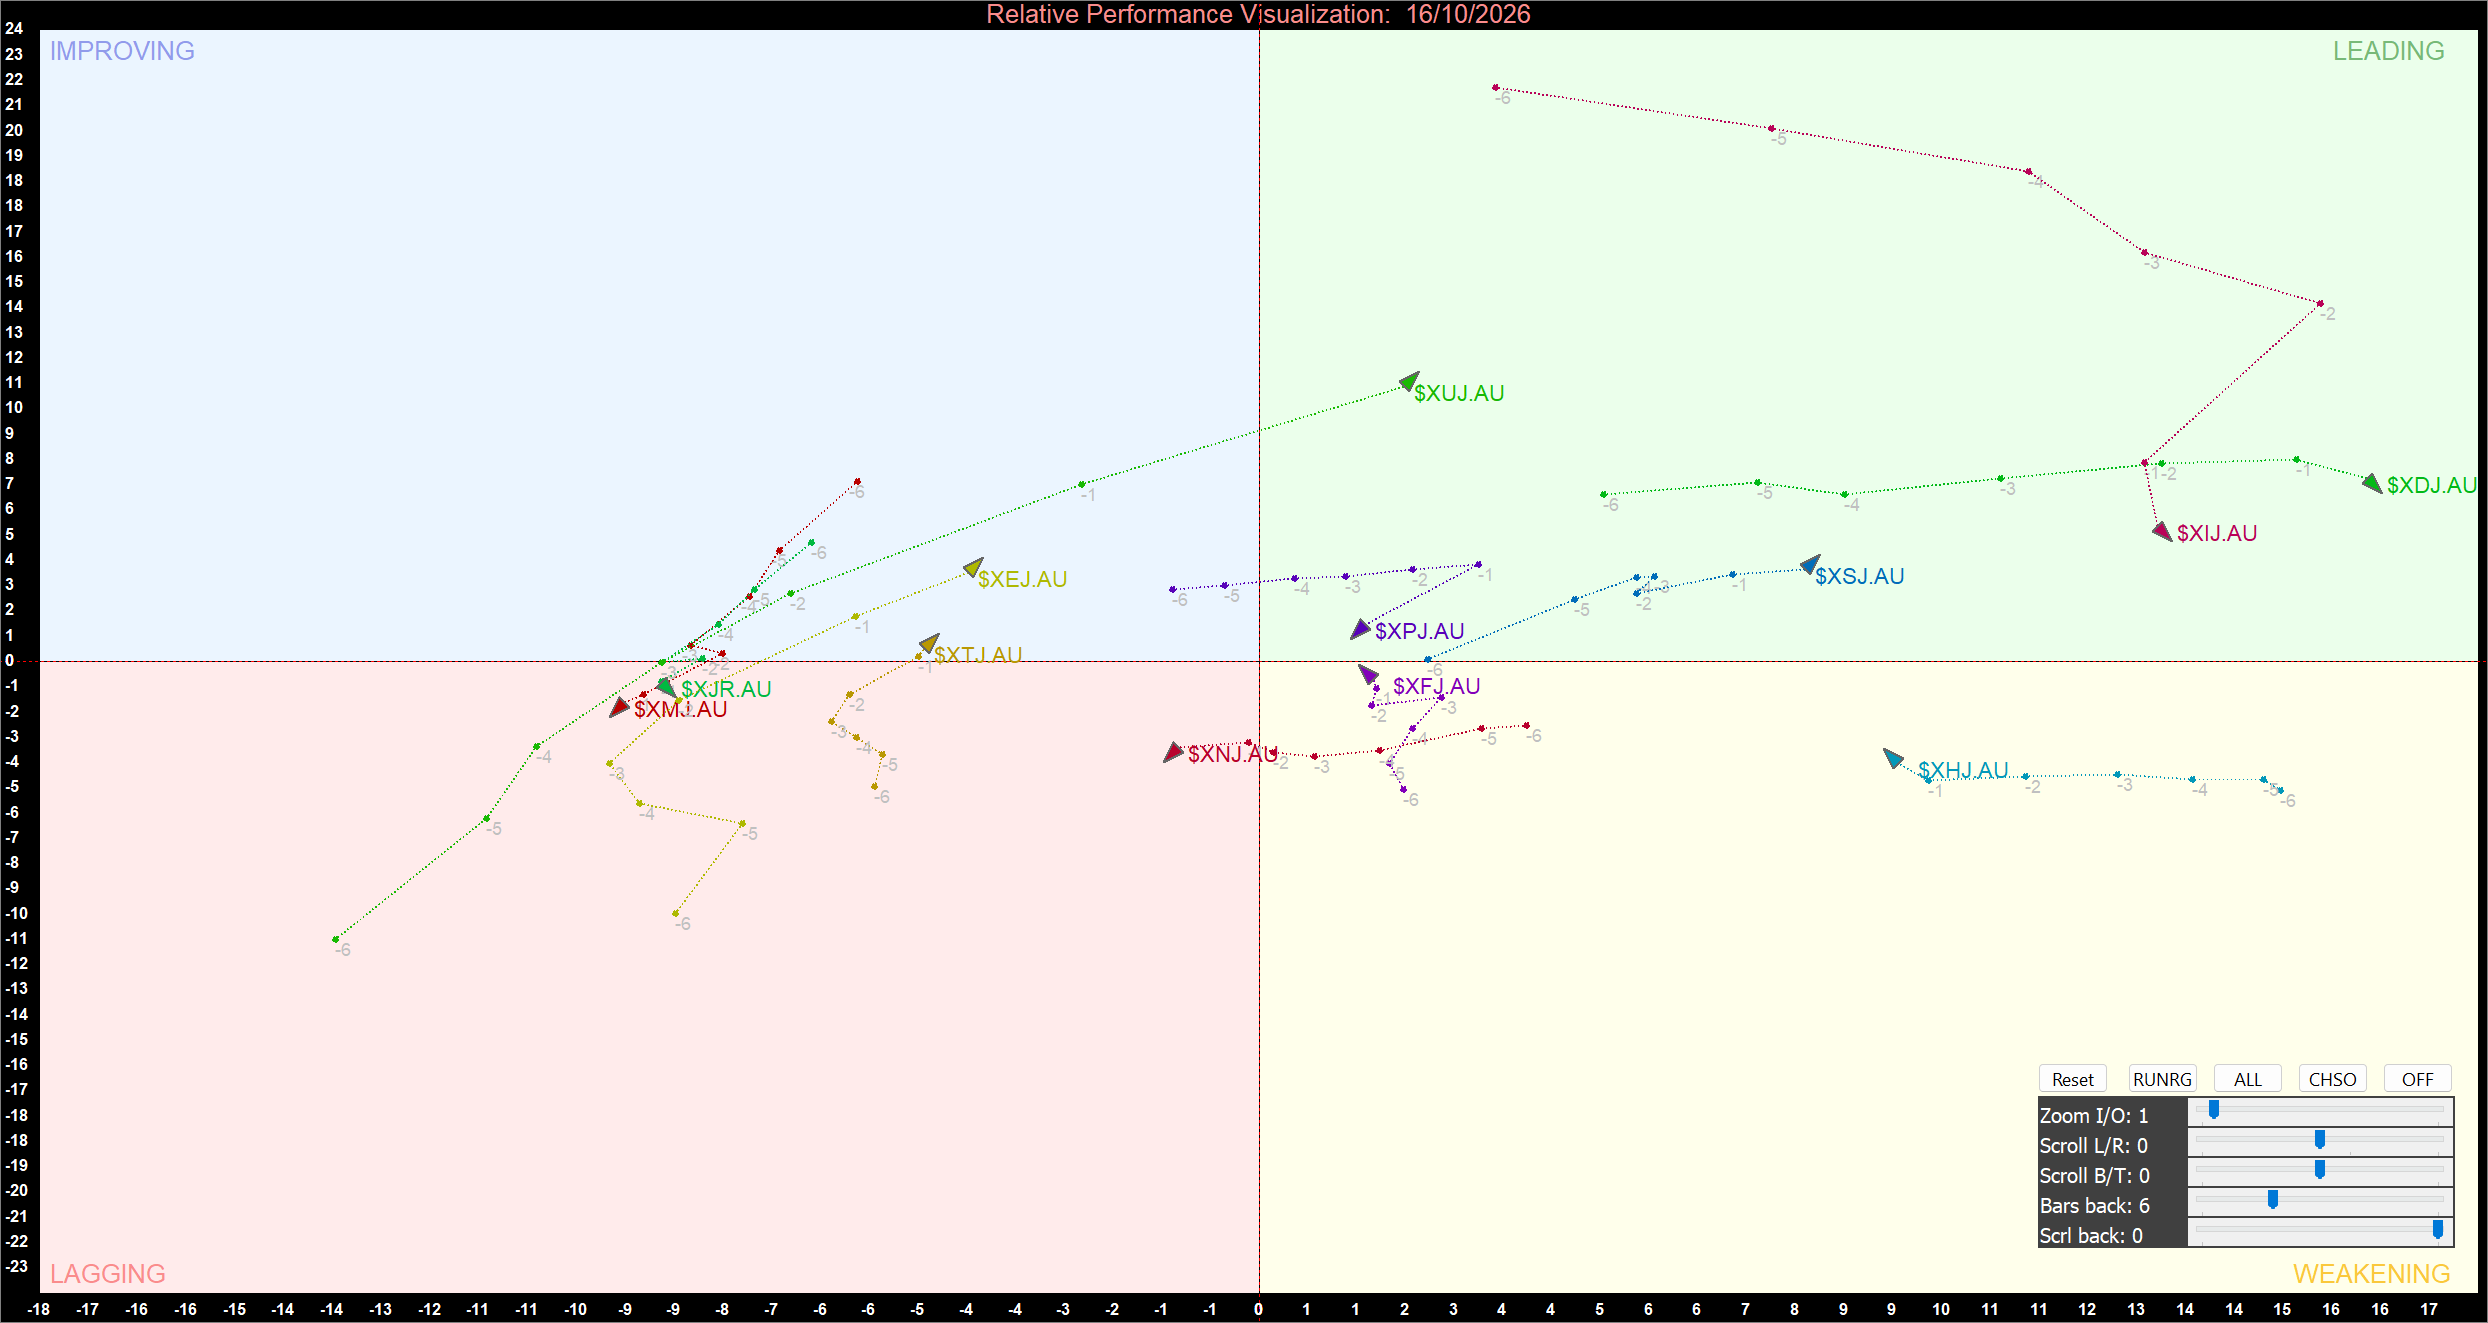
ASX Sector Relative Momentum Chart (at the closing price of 16/10/2026). Powered by: amibroker.com.
Leading Quadrant
Utilities (ASX:XUJ), Consumer Discretionary (ASX:XDJ), Information Technology (ASX:XIJ), Consumer Staples (ASX:XSJ) and Real Estate (ASX:XPJ) are positioned in the Leading quadrant. Their locations above the horizontal midpoint and to the right of the vertical axis indicate relatively stronger momentum and relative strength.
Utilities maintains a particularly strong position, with its trajectory rising substantially within Leading. This indicates that the sector continues to demonstrate favourable relative momentum compared with the broader market. Consumer Discretionary also remains firmly positioned in this quadrant, although its latest trajectory suggests a modest loss of momentum.
Information Technology presents a more nuanced picture. Despite recording the strongest daily gain among the supplied sectors, its recent trajectory points downward within Leading. This suggests that its relative momentum may be moderating even though its broader relative strength remains positive. Consumer Staples and Real Estate continue to occupy Leading, but their trajectories indicate different momentum profiles. Investors should therefore distinguish between sectors maintaining positive momentum and those potentially approaching a transition toward Weakening.
Improving Quadrant
Energy (ASX:XEJ) and Communication Services (ASX:XTJ) are positioned in Improving, indicating positive momentum readings while relative strength remains below the horizontal quadrant's right-hand threshold.
Energy's trajectory has advanced from a deeply negative position toward the central boundary, suggesting a recovery in momentum. However, its latest position remains left of the vertical axis, meaning that relative strength has yet to recover sufficiently for entry into Leading. Communication Services is also close to the horizontal midpoint, reflecting a gradual improvement rather than decisive leadership.
Both sectors remain candidates for further observation. A sustained move into Leading would provide stronger evidence that improving momentum is being accompanied by stronger relative performance. Until then, their positions suggest recovery potential rather than established leadership.
Weakening Quadrant
Financials (ASX:XFJ) and Healthcare (ASX:XHJ) occupy Weakening, where relative strength remains positive but momentum is negative.
Financials is positioned close to the centre of the chart, with its trajectory moving through negative momentum territory. Its proximity to the quadrant boundaries suggests that relatively modest changes in momentum could alter its classification. A recovery above the horizontal midpoint would support a transition back toward Leading, whereas further deterioration could weaken its relative position.
Healthcare remains further to the right, indicating positive relative strength despite its negative momentum reading. Its trajectory has moved downward across the chart, suggesting that its previous relative strength is losing momentum. A renewed upward turn would be needed to signal that the sector is regaining momentum. Until such a change occurs, Healthcare's position indicates a weakening trend rather than a confirmed recovery.
Lagging Quadrant
Materials (ASX:XMJ), Resources (ASX:XJR) and Industrials (ASX:XNJ) occupy Lagging, indicating negative relative strength and momentum.
Materials and Resources remain below the horizontal midpoint and left of the vertical axis. Although both sectors recorded substantial daily gains, their positions indicate that broader relative momentum remains weak. Their recent trajectories suggest some recovery from earlier weakness, but neither sector has established a clear transition into Improving.
Industrials also remains in Lagging, with negative readings for both relative strength and momentum. Its position indicates continued underperformance compared with sectors in the right-hand quadrants. A sustained upward trajectory toward Improving would provide an early indication of a potential recovery, but the current chart does not yet confirm such a transition.
Bottom Line
The 16 October 2026 Relative Rotation Graph highlights strong relative momentum in Utilities and continued Leadership in Consumer Discretionary, while Information Technology shows signs of weakening momentum despite its strong daily gain. Energy and Communication Services are improving, whereas Financials and Healthcare remain in Weakening. Materials, Resources and Industrials continue to lag. The next important developments will be whether leading sectors sustain their momentum and whether the lagging sectors can establish a durable upward trajectory toward Improving.


 Nov 12, 2026





 Please wait processing your request...