
 CA
 NZ
 UK
 US
 IND

 AU

 Share
 X (Formerly Twitter)
 Whatsapp
 Facebook
 LinkedIn
 Telegram
 Email This Article
 Copy Link
 Summarize with AI
 Chat GPT
 Perplexity

Key Momentum Shifts
- Technology Strengthens: Information Technology (XIJ) remains in Improving and shows the strongest upward trajectory on the latest RRG.
- Leading Group Narrows: Health Care (XHJ) and Industrials (XNJ) remain in Leading.
- Consumer Discretionary Remains Improving: Consumer Discretionary (XDJ) continues to occupy the Improving quadrant.
- Real Estate Remains Improving: Real Estate (XPJ) stays in Improving despite strong daily gains.
- Five Sectors in Weakening: Communication Services (XTJ), Consumer Staples (XSJ), Financials (XFJ), Utilities (XUJ) and Energy (XEJ) are positioned in Weakening.
- Materials and Resources Remain Lagging: Materials (XMJ) and Resources (XJR) continue to occupy the Lagging quadrant.
- Strongest Daily Performance: Real Estate gained 3.60%, recording the strongest daily performance among the twelve sectors.
- Broad Market Rebound: Eleven of the twelve sectors advanced, although several remain in Weakening or Lagging on the RRG.
The latest Relative Rotation Graph for 30 September 2026 shows continued divergence across ASX sector momentum. Health Care and Industrials remain in Leading, while Consumer Discretionary, Information Technology and Real Estate occupy Improving. Communication Services, Consumer Staples, Financials, Utilities and Energy are positioned in Weakening, while Materials and Resources remain in Lagging.
The chart also highlights the distinction between daily price performance and broader relative momentum. Real Estate recorded the strongest daily gain at 3.60% but remains in Improving rather than Leading. Similarly, Materials and Resources delivered positive daily returns while remaining in Lagging, demonstrating that one strong session does not necessarily translate into an immediate improvement in relative momentum.
Momentum Breakdown by Quadrant
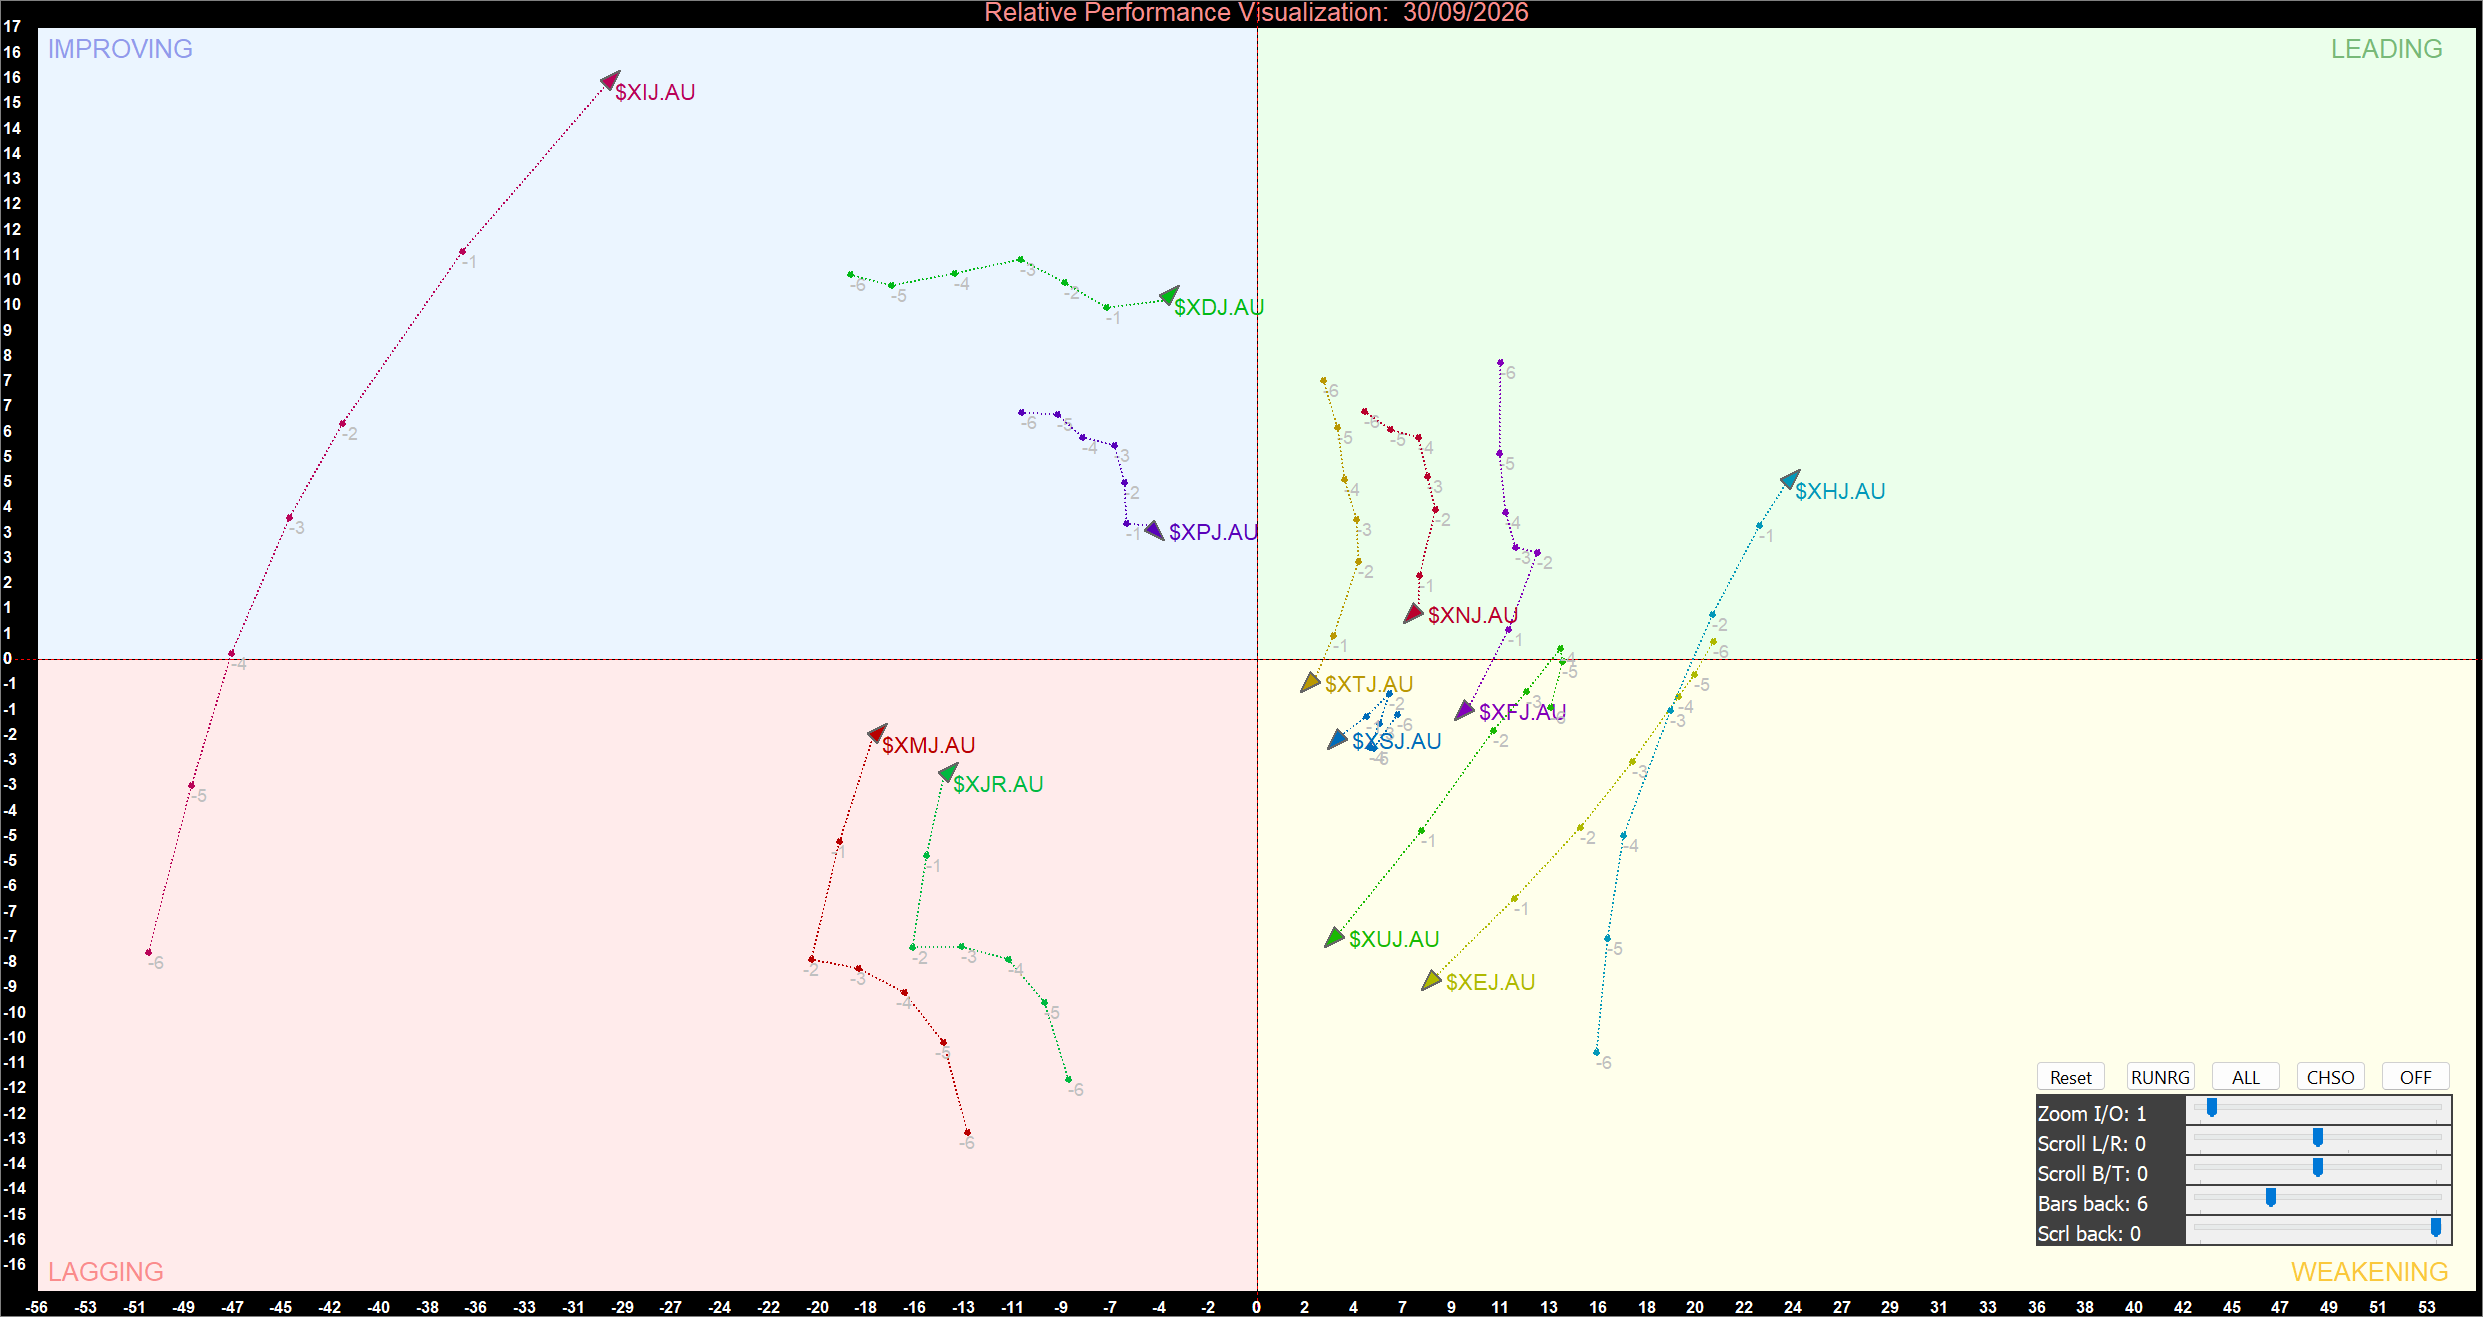
ASX Sector Relative Momentum Chart at the closing price of 30/09/2026. Powered by: amibroker.com.
Leading Quadrant
Health Care (XHJ) and Industrials (XNJ) remain positioned in the Leading quadrant. Their locations above the horizontal midpoint and to the right of the vertical axis indicate relatively stronger momentum and relative strength compared with the broader market.
Health Care gained 0.71% during the latest session, while Industrials advanced 1.65%. Both sectors also benefited from the broad market rebound following the August Inflation release.
The trajectories of the Leading sectors remain important. Continued movement toward the upper-right area would reinforce their existing relative position, while movement back toward the horizontal midpoint could indicate a gradual deterioration in relative momentum.
Improving Quadrant
Consumer Discretionary (XDJ), Information Technology (XIJ) and Real Estate (XPJ) remain positioned in Improving.
Information Technology remains the most notable sector within this group. Although XIJ declined 0.41% on 30 September, the chart shows a strong upward trajectory from the previous observations. This indicates that its broader relative momentum has improved substantially despite the latest modest decline.
Consumer Discretionary gained 2.27%, while Real Estate surged 3.60%. The strong daily performance of both sectors occurred as softer monthly inflation reduced market expectations for another immediate RBA rate increase.
For Information Technology, continued movement toward the Leading quadrant would provide further evidence of a transition from improving relative momentum toward stronger relative strength.
Weakening Quadrant
Communication Services (XTJ), Consumer Staples (XSJ), Financials (XFJ), Utilities (XUJ) and Energy (XEJ) remain positioned in the Weakening quadrant.
Daily performance was positive across all five sectors, with Communication Services gaining 1.94%, Energy rising 1.56%, Consumer Staples increasing 0.57%, Utilities advancing 0.48% and Financials adding 0.27%.
However, their positions on the RRG indicate that recent price gains have not yet translated into stronger relative momentum. This distinction is important because RRG positioning measures the direction and strength of relative performance over a broader period rather than simply ranking sectors according to their latest daily returns.
Lagging Quadrant
Materials (XMJ) and Resources (XJR) remain in the Lagging quadrant. Materials gained 0.67%, while Resources advanced 0.79% during the latest session.
The positive daily performances were supported by broader market strength, while resources stocks also remained influenced by strong gold prices and ongoing corporate activity surrounding Northern Star Resources.
Despite these gains, both sectors remain in the lower-left portion of the RRG, indicating weaker relative momentum and relative strength. Sustained movement toward the centre of the chart would provide stronger evidence that Materials and Resources are beginning to recover from their current Lagging positions.
Bottom Line
The 30 September 2026 ASX Relative Rotation Graph shows continued divergence across sector momentum. Health Care and Industrials remain in Leading, while Consumer Discretionary, Information Technology and Real Estate occupy Improving.
Communication Services, Consumer Staples, Financials, Utilities and Energy remain in Weakening, while Materials and Resources continue to occupy Lagging.
The most notable feature of the latest chart is the strong upward trajectory of Information Technology within the Improving quadrant. Meanwhile, Real Estate recorded the strongest daily performance at 3.60%, although its broader RRG positioning remains Improving rather than Leading.
Overall, the latest RRG continues to show dynamic sector rotation. The trajectories of Information Technology, Consumer Discretionary and Real Estate, together with the movements of Materials and Resources toward or away from the centre of the chart, remain important indicators for assessing changes in relative sector momentum.


 Nov 12, 2026





 Please wait processing your request...