
 CA
 NZ
 UK
 US
 IND

 AU

 Share
 X (Formerly Twitter)
 Whatsapp
 Facebook
 LinkedIn
 Telegram
 Email This Article
 Copy Link
 Summarize with AI
 Chat GPT
 Perplexity

The latest momentum chart reveals a market undergoing a violent divergence. While one sector has moved into a nearly parabolic state of leadership, the vast majority of the ASX is experiencing a sharp loss in both relative strength and momentum, as illustrated by the sweeping "leftward" trajectories across the chart.
Key Highlights
- Energy Unplugged: The Energy (XEJ) sector has detached from the broader market, extending its lead with an almost vertical momentum trajectory deep into the Leading quadrant.
- Growth Exhaustion: Former recovery leaders, specifically Info Tech (XIJ), are showing significant "hooks" in momentum, indicating a rapid transition toward the Weakening zone.
- Defensive Rotation: Only Consumer Staples (XSJ) and Utilities (XUJ) are maintaining stable paths within the Leading quadrant, serving as the market's primary blue-chip volatility buffers.
Daily ASX Sector Momentum chart – 19/03/2026
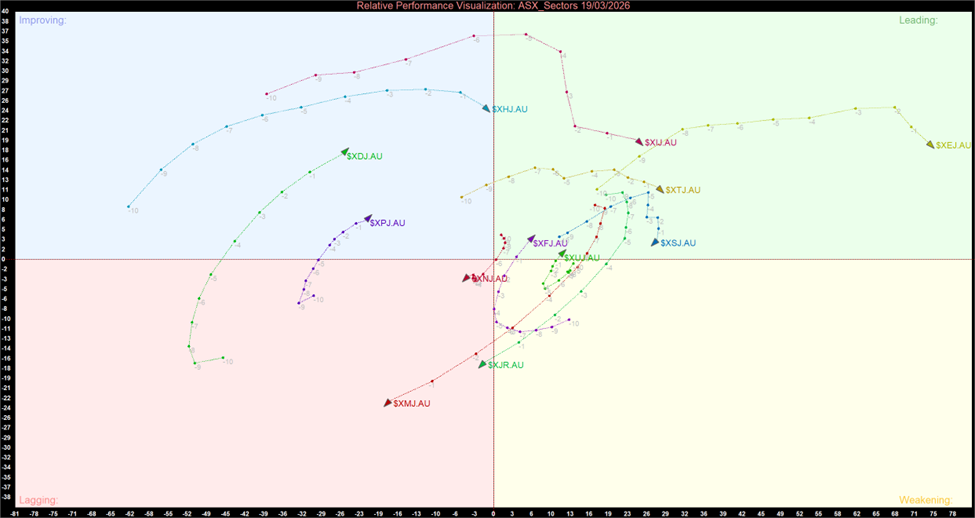
ASX Sector Daily Momentum Chart (at the closing price of 19th March 2026). Powered by: amibroker.com
Daily ASX Sector Momentum Summary – 19/03/2026
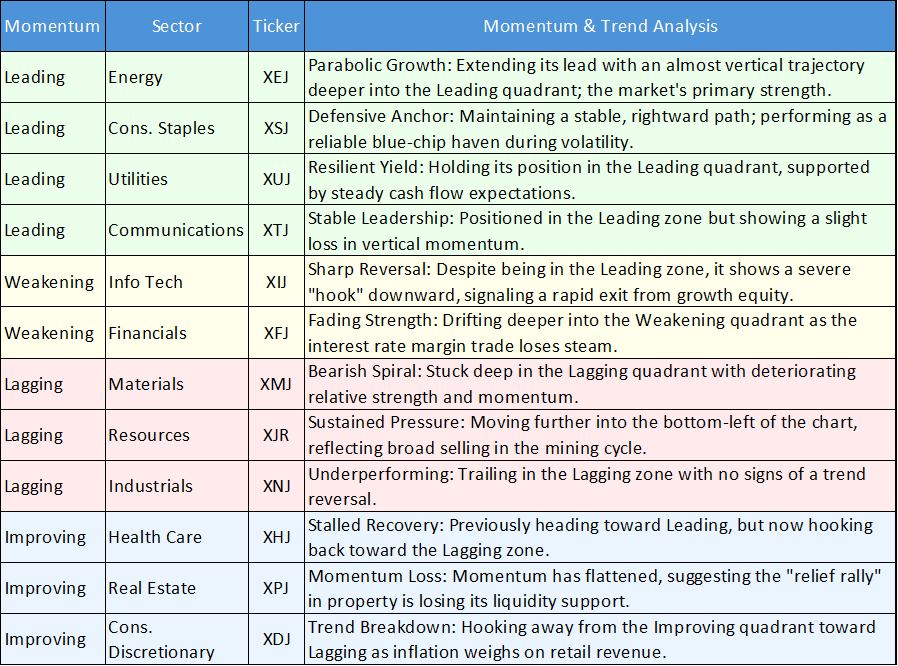
Momentum Analysis: A Market Divided
The Absolute Leader
- Energy (XEJ): Displays the most extreme relative strength on the board. Its position in the top-right of the Leading quadrant suggests it is currently the sole beneficiary of the "fear-driven" commodity spike, heavily outweighing other sectors in equity
The Fading Growth & Improving Plays
- Info Tech (XIJ): While still technically "Leading," its sharp momentum reversal suggests that the recent interest rate concerns are triggering a massive exit from tech growth.
- Health Care (XHJ) & Real Estate (XPJ): Both had been "Improving," but the latest data shows them stalling and hooking back toward the Lagging quadrant, failing to sustain their recent recovery trends.
The Heavy Laggards
- Materials (XMJ) & Resources (XJR): These sectors are stuck in a bearish spiral within the Lagging quadrant. Their continued move deeper into the bottom-left reflects the significant pressure on iron ore and gold miners amid inflation and demand fears.
- Financials (XFJ): Drifting further into the Weakening quadrant, signaling that the banking sector is no longer a source of relative strength for the index.
Strategic Outlook
The RRG chart for March 19, 2026, confirms a "Flight to Energy". With almost all other cyclical sectors (Materials, Financials, Tech) showing deteriorating momentum, the market's cash flow is becoming dangerously concentrated. Investors may look to the stable paths of Consumer Staples and Utilities to diversify away from the high-volatility "hook" seen in Energy and Tech.


 Nov 12, 2026





 Please wait processing your request...