
 CA
 NZ
 UK
 US
 IND

 AU

 Share
 X (Formerly Twitter)
 Whatsapp
 Facebook
 LinkedIn
 Telegram
 Email This Article
 Copy Link
 Summarize with AI
 Chat GPT
 Perplexity

Key Highlights
- Consumer Discretionary (XDJ), Information Technology (XIJ), Consumer Staples (XSJ) and Real Estate (XPJ) remain in the Leading quadrant, alongside Utilities (XUJ) moving into Improving rather than Leading.
- Utilities (XUJ) has moved into Improving, indicating a positive shift in its momentum classification.
- Energy (XEJ) and Communication Services (XTJ) are positioned in Improving, near the boundary with Leading.
- Industrials (XNJ), Resources (XJR) and Materials (XMJ) have entered the Lagging quadrant, marking a deterioration in their relative momentum positions.
- Healthcare (XHJ) and Financials (XFJ) remain in Weakening, with momentum below the horizontal midpoint.
- The chart shows continued divergence across sectors, with momentum Leadership concentrated in selected groups rather than broadly shared.
- The transition of XNJ, XJR and XMJ into Lagging is the clearest negative shift in the current sector configuration.
- Quadrant positioning reflects relative momentum and strength over the chart’s observation period, not simply the latest daily return.
The ASX sector momentum structure on 15 October 2026 shows a mixed rotation, with Consumer Discretionary, Information Technology, Consumer Staples and Real Estate positioned in Leading, while Utilities, Energy and Communication Services occupy Improving. Healthcare and Financials remain in Weakening, while Industrials, Resources and Materials have moved into Lagging. The latest configuration points to selective momentum strength alongside deterioration across several cyclical and resource-linked sectors.
ASX Sector Momentum Quadrants
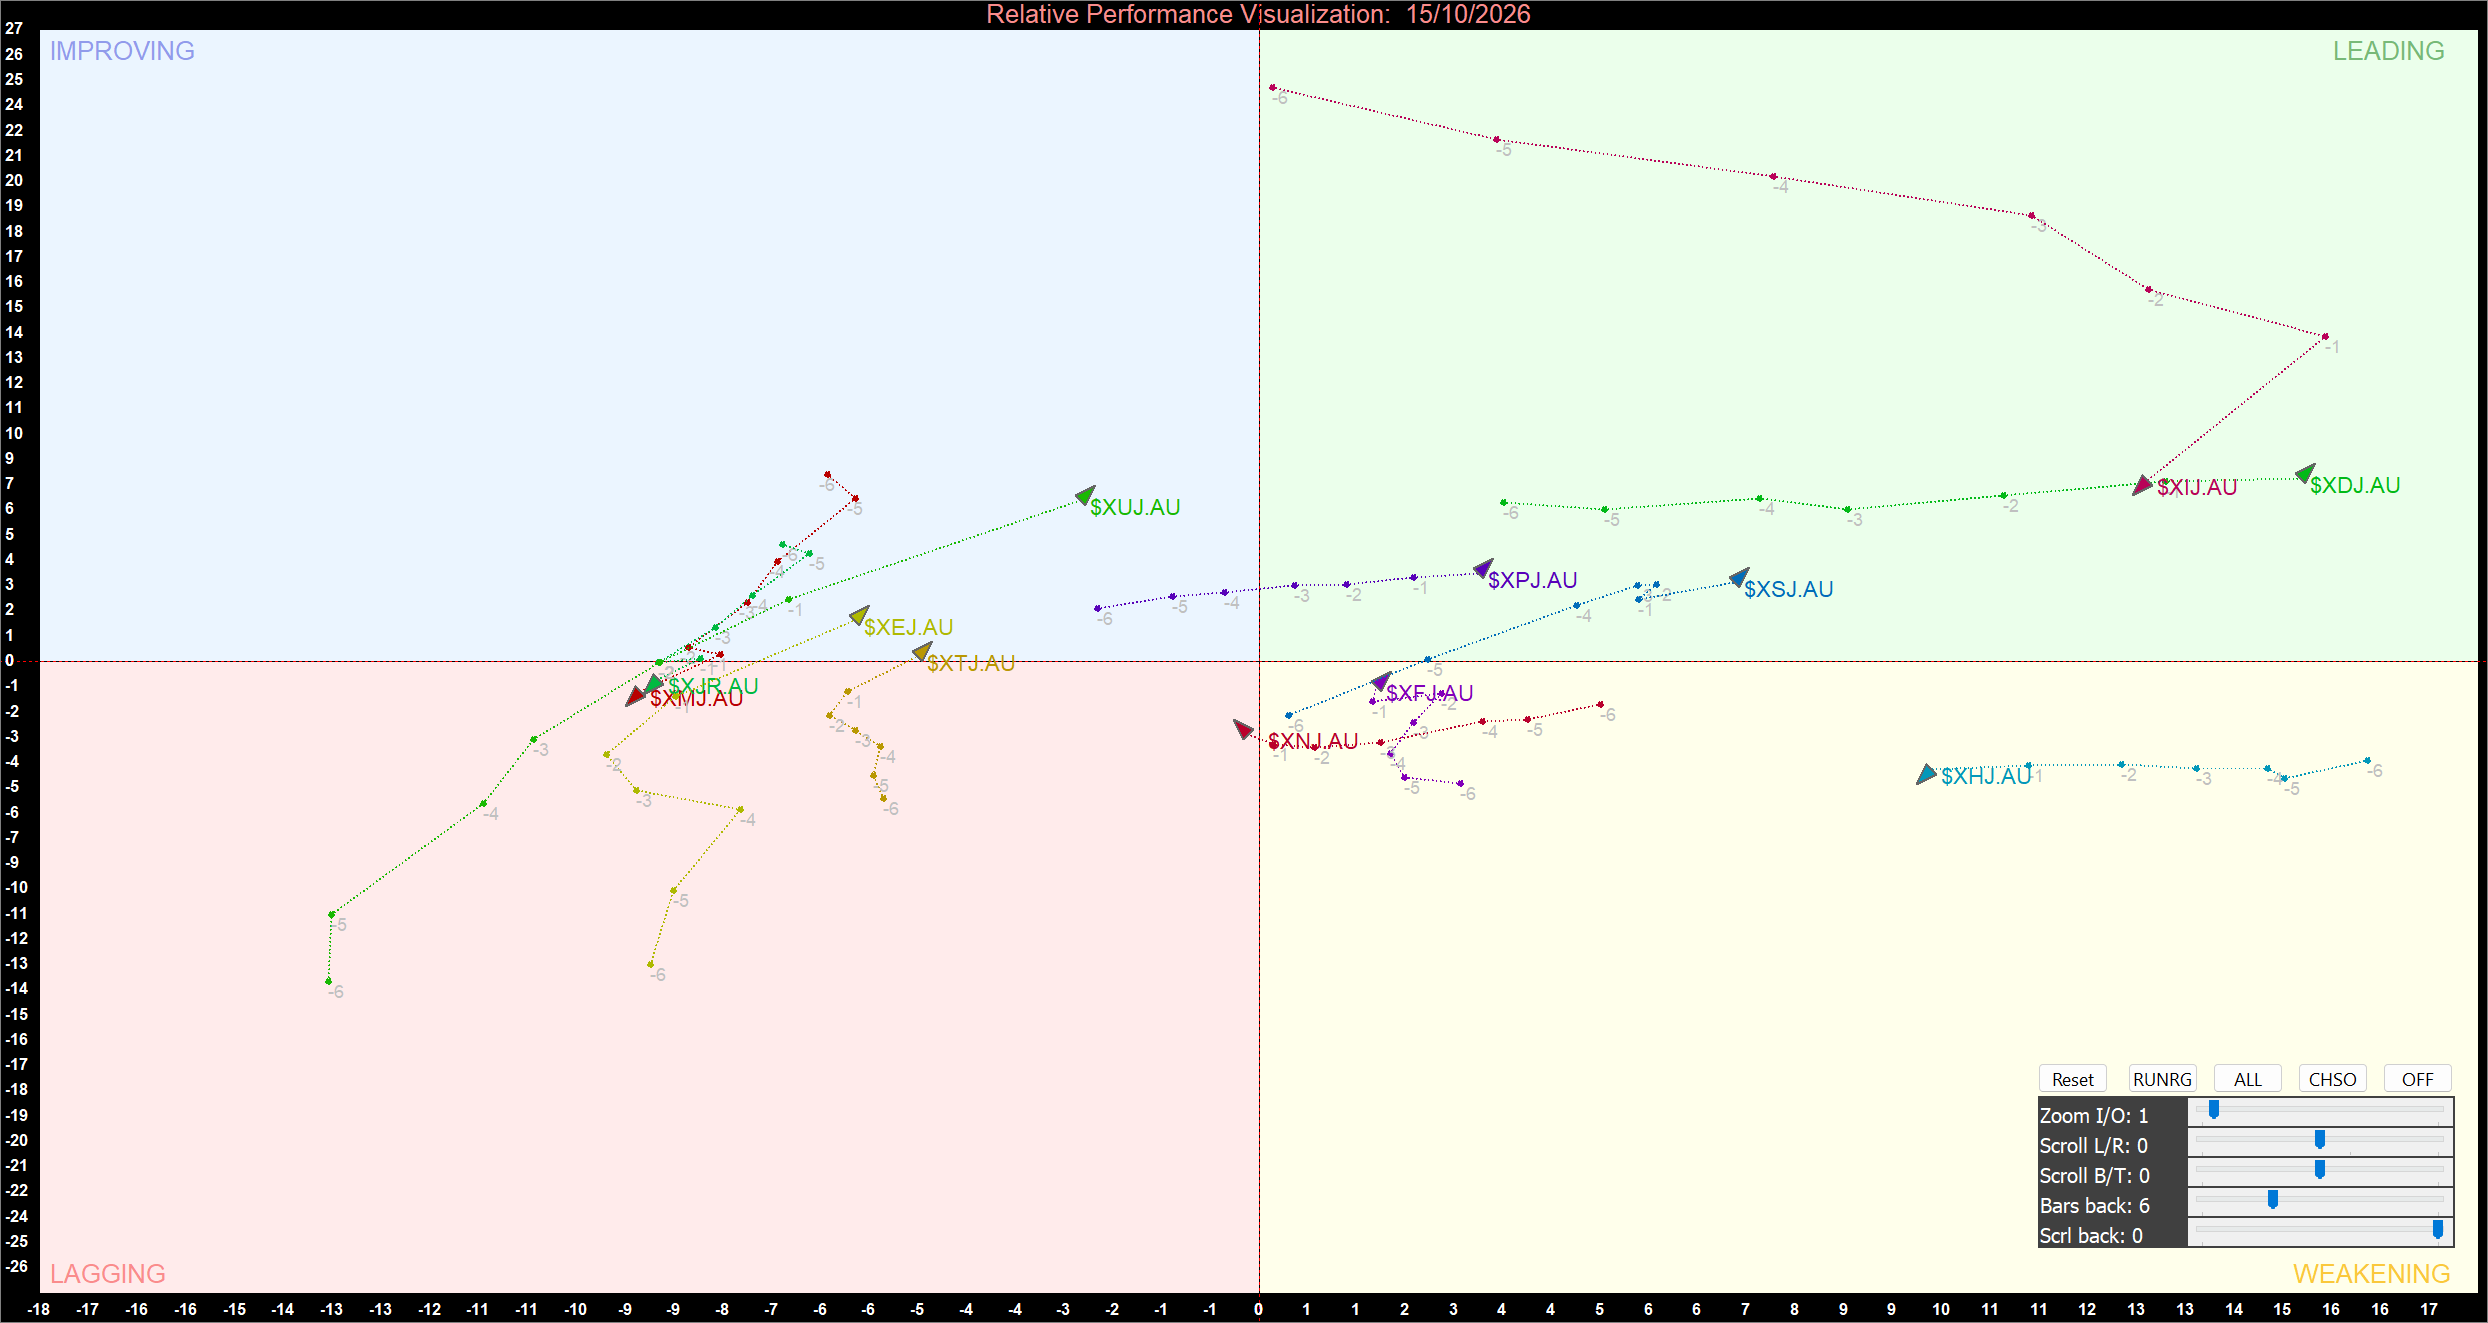
ASX Sector Relative Momentum Chart at the closing price of 15/10/2026. Powered by: amibroker.com
Consumer Discretionary, Information Technology, Consumer Staples and Real Estate Remain in Leading
Consumer Discretionary (XDJ), Information Technology (XIJ), Consumer Staples (XSJ) and Real Estate (XPJ) are positioned in the Leading quadrant. Their locations above the horizontal midpoint and to the right of the vertical axis indicate that these sectors retain relatively strong momentum and relative positioning compared with sectors in the lower half of the chart.
Information Technology and Consumer Discretionary occupy particularly elevated positions on the momentum axis, although the plotted trajectories show some variation in direction. Consumer Staples and Real Estate are also in Leading, but sit closer to the centre of the chart. Their positions remain constructive, while the direction of subsequent observations will help determine whether relative strength is maintained or begins to fade. Leading status should therefore be assessed alongside each sector’s trajectory rather than treated as a guarantee of continued outperformance.
Utilities, Energy and Communication Services Show Improving Momentum
Utilities (XUJ) is positioned in Improving, having moved into the upper-left quadrant. This indicates that momentum has turned positive, although its relative-strength position has not yet crossed into Leading. Continued movement toward the upper-right would provide stronger evidence that the sector is improving both its momentum and relative standing.
Energy (XEJ) and Communication Services (XTJ) are also positioned in Improving, close to the horizontal midpoint. Their locations suggest a potential recovery in momentum, but both remain near a quadrant boundary. A sustained upward trajectory would strengthen the improvement signal, while a return below the horizontal axis would weaken it. These sectors are therefore at an important transition stage rather than established leaders.
Healthcare and Financials Remain in Weakening
Healthcare (XHJ) and Financials (XFJ) remain in the Weakening quadrant, below the horizontal midpoint but to the right of the vertical axis. This positioning indicates that their relative strength remains comparatively better than that of sectors deep in Lagging, while momentum is deteriorating. Healthcare is positioned farther to the right, suggesting a stronger relative position despite negative momentum.
For both sectors, movement back above the horizontal midpoint would be an initial sign of stabilisation. Until such a shift occurs, the chart indicates that their momentum is not yet aligned with the Leading or Improving groups. A continued downward trajectory, particularly toward the lower-left, would increase the risk of a transition into Lagging.
Industrials, Resources and Materials Enter Lagging
Industrials (XNJ), Resources (XJR) and Materials (XMJ) have entered the Lagging quadrant. Their positions below the horizontal midpoint and to the left of the vertical axis indicate weaker relative momentum and relative performance. This transition is a notable deterioration from a momentum perspective, as these sectors are no longer simply losing momentum while remaining on the stronger side of the relative-strength axis.
Resources and Materials are closely grouped near the boundary between Lagging and Improving, while Industrials is also positioned in the lower-left area. A move back above the horizontal midpoint would be needed to signal an initial momentum recovery; a further move toward the lower-left would reinforce the current weakness. Their trajectories Warrant attention because a sustained Reversal could signal stabilisation, but the present quadrant positions remain negative.
Momentum Rotation Remains Uneven
The chart reinforces the distinction between daily price changes and relative momentum. A sector may rise during a single session while remaining in Weakening or Lagging, because the Relative Rotation Graph reflects a broader sequence of relative strength and momentum observations. Equally, a sector with a small daily decline may remain in Improving if its underlying trajectory is recovering.
The current distribution shows four sectors in Leading, three in Improving, two in Weakening and three in Lagging. Leadership remains selective, while the entry of Industrials, Resources and Materials into Lagging highlights deterioration across several sectors. Utilities’ move into Improving is a positive transition, but it has not yet confirmed a return to Leading.
Bottom Line
The ASX sector momentum structure on 15 October 2026 indicates selective leadership and uneven rotation. Consumer Discretionary, Information Technology, Consumer Staples and Real Estate remain in Leading, while Utilities, Energy and Communication Services occupy Improving. Healthcare and Financials remain in Weakening, and Industrials, Resources and Materials have entered Lagging.
From a momentum perspective, the most important positive shift is Utilities moving into Improving. The clearest negative change is the entry of Industrials, Resources and Materials into Lagging. Continued movement of Improving sectors toward the upper-right would strengthen the prospect of broader leadership, while a recovery above the horizontal midpoint would be needed to improve the outlook for sectors in Weakening and Lagging. Overall, the chart continues to favour selective sector momentum rather than a broad-based advance.


 Nov 12, 2026





 Please wait processing your request...