
 CA
 NZ
 UK
 US
 IND

 AU

 Share
 X (Formerly Twitter)
 Whatsapp
 Facebook
 LinkedIn
 Telegram
 Email This Article
 Copy Link
 Summarize with AI
 Chat GPT
 Perplexity

Key Highlights
- Information Technology (XIJ) remained in the Leading quadrant, but its pronounced downward trajectory indicated a marked loss of momentum.
- Consumer Discretionary (XDJ), Real Estate (XPJ) and Consumer Staples (XSJ) remained in Leading, although their paths showed different degrees of stability.
- Utilities (XUJ) occupied Improving territory, with its trajectory suggesting a recovery in relative momentum.
- Materials (XMJ) and Resources (XJR) were positioned around the Lagging–Improving boundary, leaving their next directional moves important.
- Financials (XFJ), Industrials (XNJ) and Healthcare (XHJ) remained in Weakening, with negative momentum despite positive relative positioning.
- Energy (XEJ) and Communication Services (XTJ) remained in Lagging, with no confirmed transition into Improving.
- The chart highlighted a divergence between sectors retaining relative Leadership and those attempting to recover from weaker momentum.
The ASX sector relative momentum visualisation dated 14 October 2026 showed a divided momentum landscape. Information Technology remained well inside Leading but its path continued to slope sharply lower. Consumer Discretionary, Real Estate and Consumer Staples also occupied Leading, while Financials, Industrials and Healthcare remained in Weakening territory.
Utilities was positioned in Improving. Materials and Resources sat close to the boundary between Lagging and Improving, making their trajectory especially important to the next classification. Energy and Communication Services remained in Lagging. The chart underlines that quadrant position and trajectory must be assessed together: leadership can weaken before a sector crosses into another quadrant, and an improving path is not, by itself, confirmation of a durable recovery.
ASX Sector Momentum Quadrants
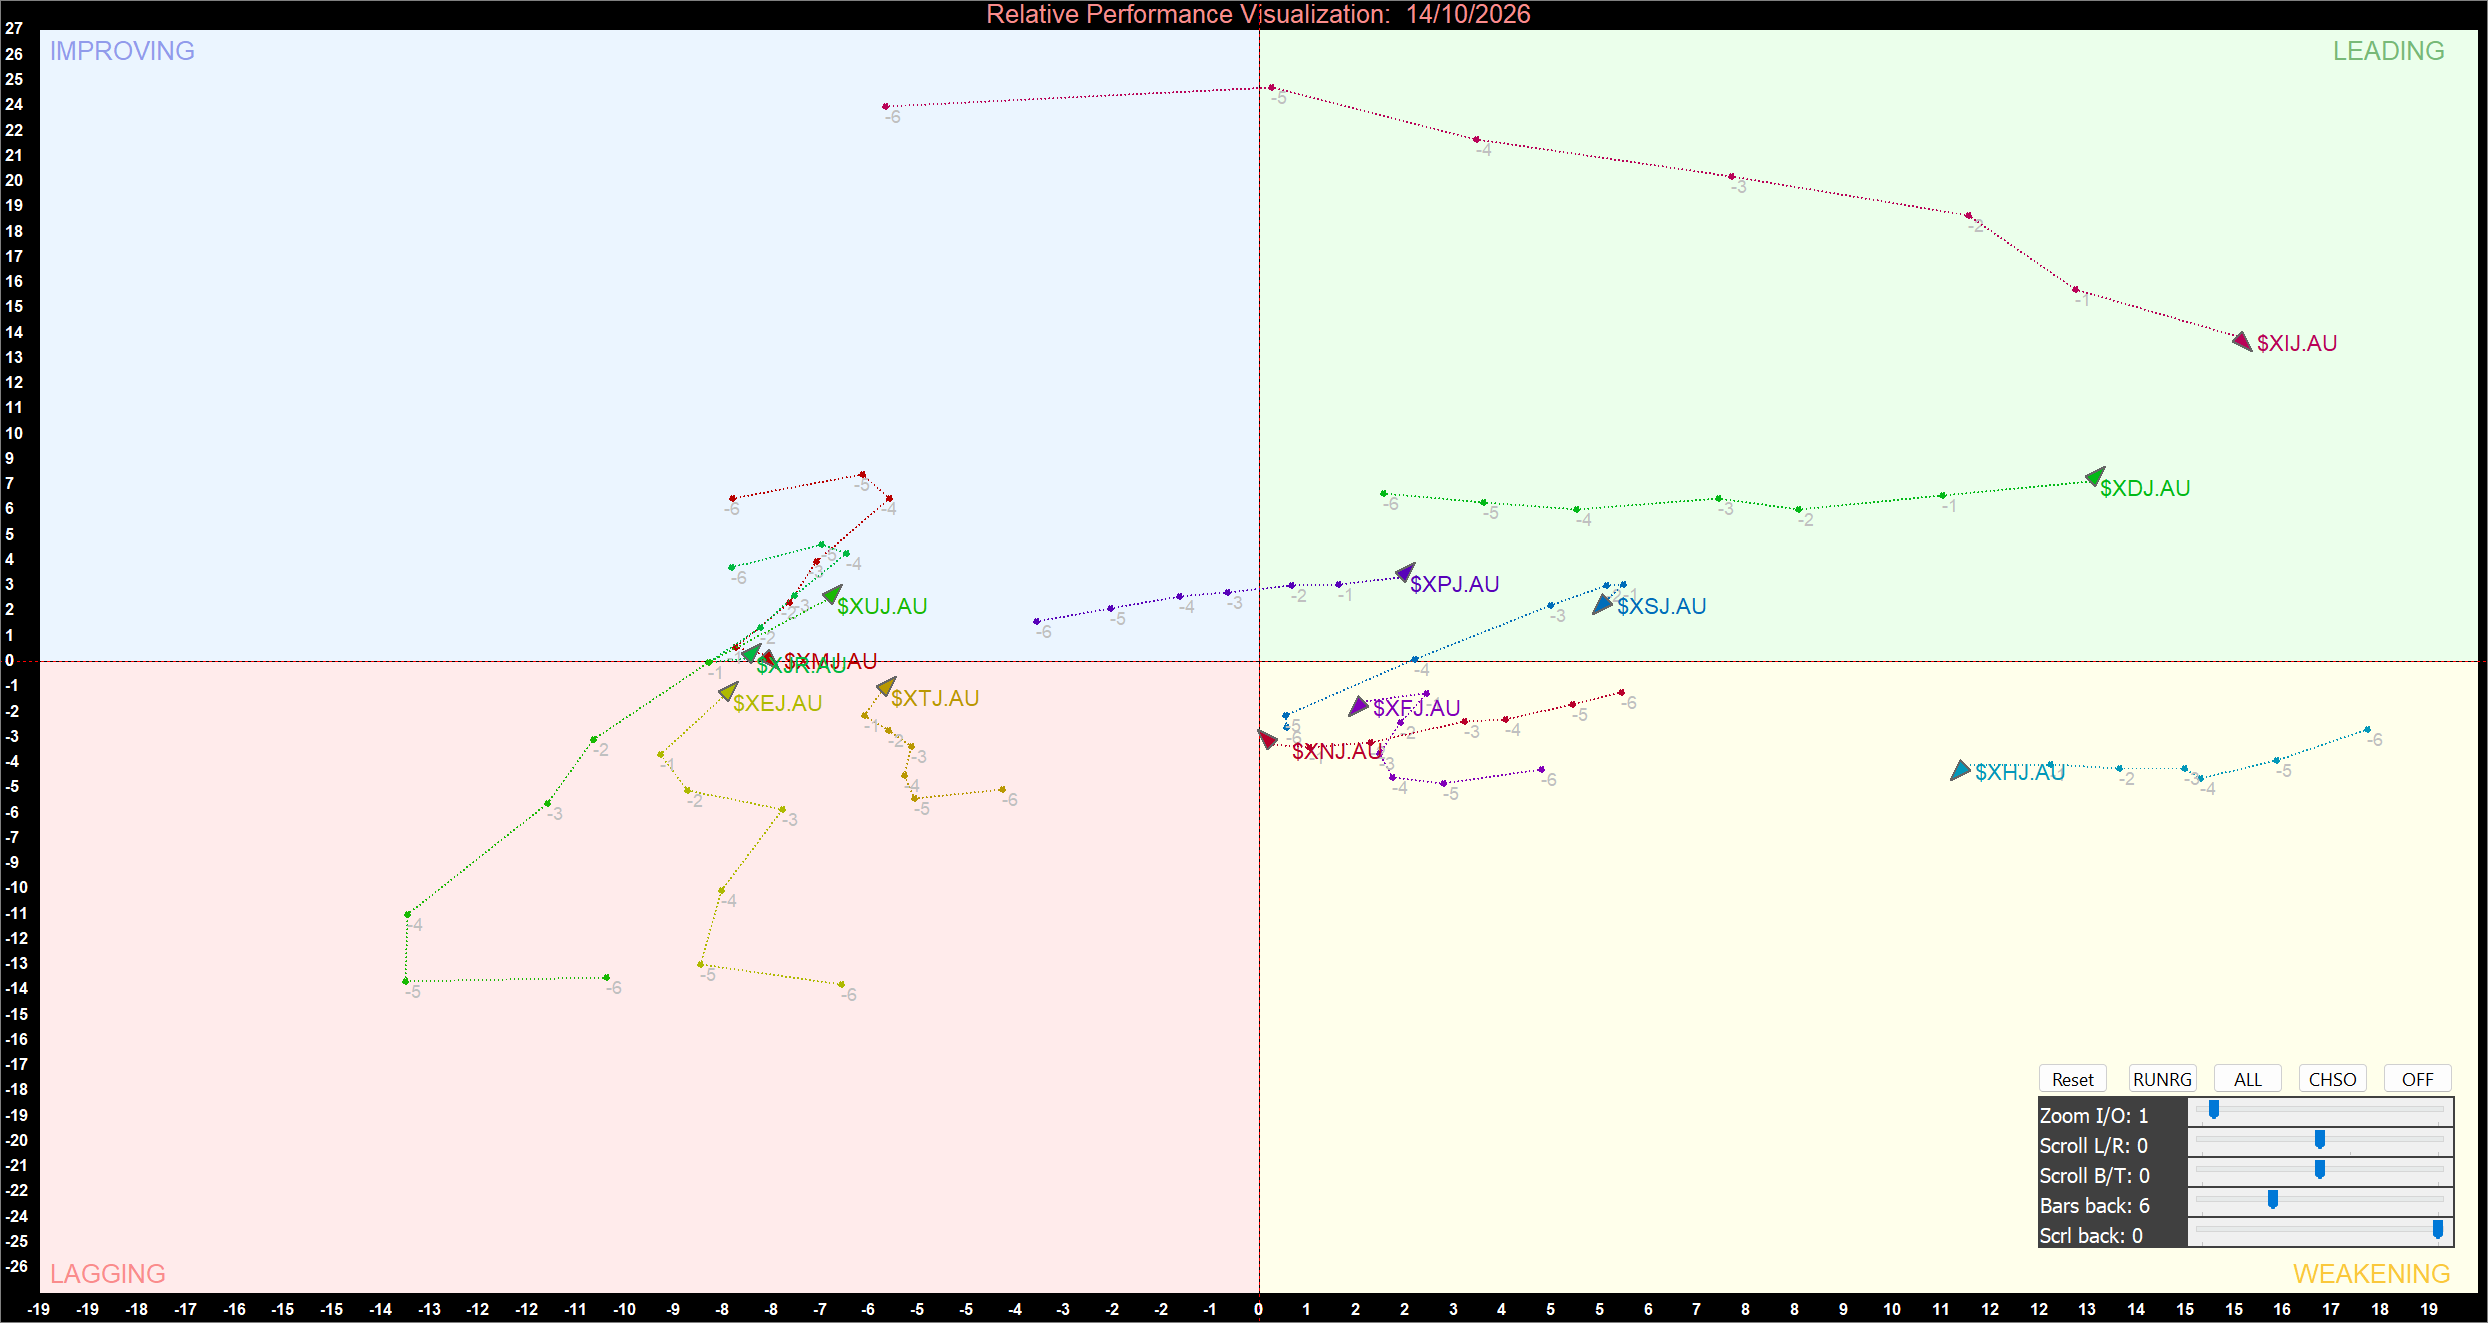
ASX Sector Relative Momentum Chart at the closing price of 14/10/2026. Powered by: amibroker.com
Information Technology Loses Momentum Despite Leadership
Information Technology remained deep inside the Leading quadrant, reflecting a strong relative position on the chart’s horizontal dimension. However, its trajectory moved noticeably downward across the latest observations. This indicates that momentum has deteriorated even though the sector has not yet lost its leading classification. A leading position describes relative standing; it does not guarantee that momentum is strengthening.
If the downward path continues, Information Technology could move toward Weakening. The next observations should therefore be assessed for signs of stabilisation or a further loss of momentum. Consumer Discretionary remained in Leading and its latest path was comparatively firm, while Real Estate and Consumer Staples also held positive positions. Their continued leadership depends on whether their relative momentum can be maintained.
Utilities Improves as Materials and Resources Approach the Boundary
Utilities was positioned in Improving, with its trajectory suggesting a recovery from a weaker relative position. The move is constructive, but the sector has not established leadership simply by moving toward the central axes. A sustained crossing into Leading would provide stronger evidence that both relative position and momentum had improved. A renewed turn lower would instead suggest that the recovery attempt had stalled.
Materials and Resources were clustered around the boundary between Lagging and Improving. Their locations make a definitive quadrant label less useful than the direction of their recent paths. If the trajectories continue upward and cross into Improving, that would indicate a more convincing recovery in momentum. If they turn lower, the sectors could remain in or return to Lagging. The chart therefore presents these two groups as transitional rather than established leaders.
Energy and Communication Services Remain in Lagging
Energy and Communication Services remained in Lagging, indicating weak relative positioning and negative momentum. Their trajectories did not show a decisive crossing into Improving. A recovery attempt within Lagging should not be confused with a confirmed quadrant change; the sector needs to move toward and across the central axes before the chart supports a stronger momentum assessment.
For both sectors, the next observations will be important in determining whether downside momentum is easing or weakness is persisting. Until a clearer transition occurs, their chart positions remain less constructive than those of sectors in Leading or Improving.
Financials, Industrials and Healthcare Remain Weakening
Financials, Industrials and Healthcare occupied Weakening territory. Their positions to the right of the vertical axis indicate that relative positioning remains positive, but their locations below the horizontal axis signal negative momentum. This combination can precede further deterioration if momentum continues to decline, although a move back above the horizontal axis would suggest an improvement.
Financials and Industrials were relatively close to the centre, making their next directional movements particularly relevant. Healthcare was farther to the right but remained below the horizontal axis, illustrating that a comparatively stronger relative position can coexist with weakening momentum.
Bottom Line
The 14 October 2026 ASX sector momentum chart showed Information Technology retaining leadership while its trajectory weakened sharply. Consumer Discretionary, Real Estate and Consumer Staples remained in Leading, and Utilities occupied Improving. Materials and Resources were positioned on the Lagging - Improving boundary, while Financials, Industrials and Healthcare remained Weakening. Energy and Communication Services continued to Lag.
The principal signal is the direction of each sector’s trajectory, not the quadrant label alone. The key developments to monitor are whether Information Technology stabilises, whether Utilities sustains its recovery, whether Materials and Resources move decisively into Improving, and whether Energy and Communication Services can cross out of Lagging. Sustained movement across quadrant boundaries would provide stronger evidence of a change in sector momentum.


 Nov 12, 2026





 Please wait processing your request...