
 CA
 NZ
 UK
 US
 IND

 AU

 Share
 X (Formerly Twitter)
 Whatsapp
 Facebook
 LinkedIn
 Telegram
 Email This Article
 Copy Link
 Summarize with AI
 Chat GPT
 Perplexity

Key Momentum Shifts
- No Stocks Remain in Leading: None of the 10 selected financial stocks currently occupy the Leading quadrant.
- Seven Stocks Are Improving: ANZ, CBA, WBC, QBE, IAG, SUN and CPU are positioned in the Improving quadrant.
- Major Banks Show Improving Momentum: ANZ, WBC and CBA are all positioned in Improving, supported by positive daily performances.
- ANZ Records the Strongest Gain: ANZ advanced 1.39%, the strongest daily performance among the 10 stocks.
- NAB Remains Lagging: NAB is positioned in the Lagging quadrant despite gaining 1.11% on the day.
- Macquarie and Soul Pattinson Also Lag: MQG and SOL remain in Lagging, indicating weaker relative momentum.
- Insurance Stocks Are Improving: QBE, IAG and SUN are positioned in Improving, although their daily returns were negative.
- Computershare Is Improving: CPU sits in Improving despite recording the weakest daily performance at -0.99%.
The latest Relative Rotation Graph for 3 September 2026 shows a significant concentration of the selected ASX financial stocks in the Improving quadrant. Seven of the 10 stocks are positioned in Improving, while NAB, SOL and MQG remain in Lagging. No stocks currently occupy either Leading or Weakening. This indicates that relative momentum across the group is broadly recovering, although the recovery remains uneven.
Momentum Breakdown by Quadrant
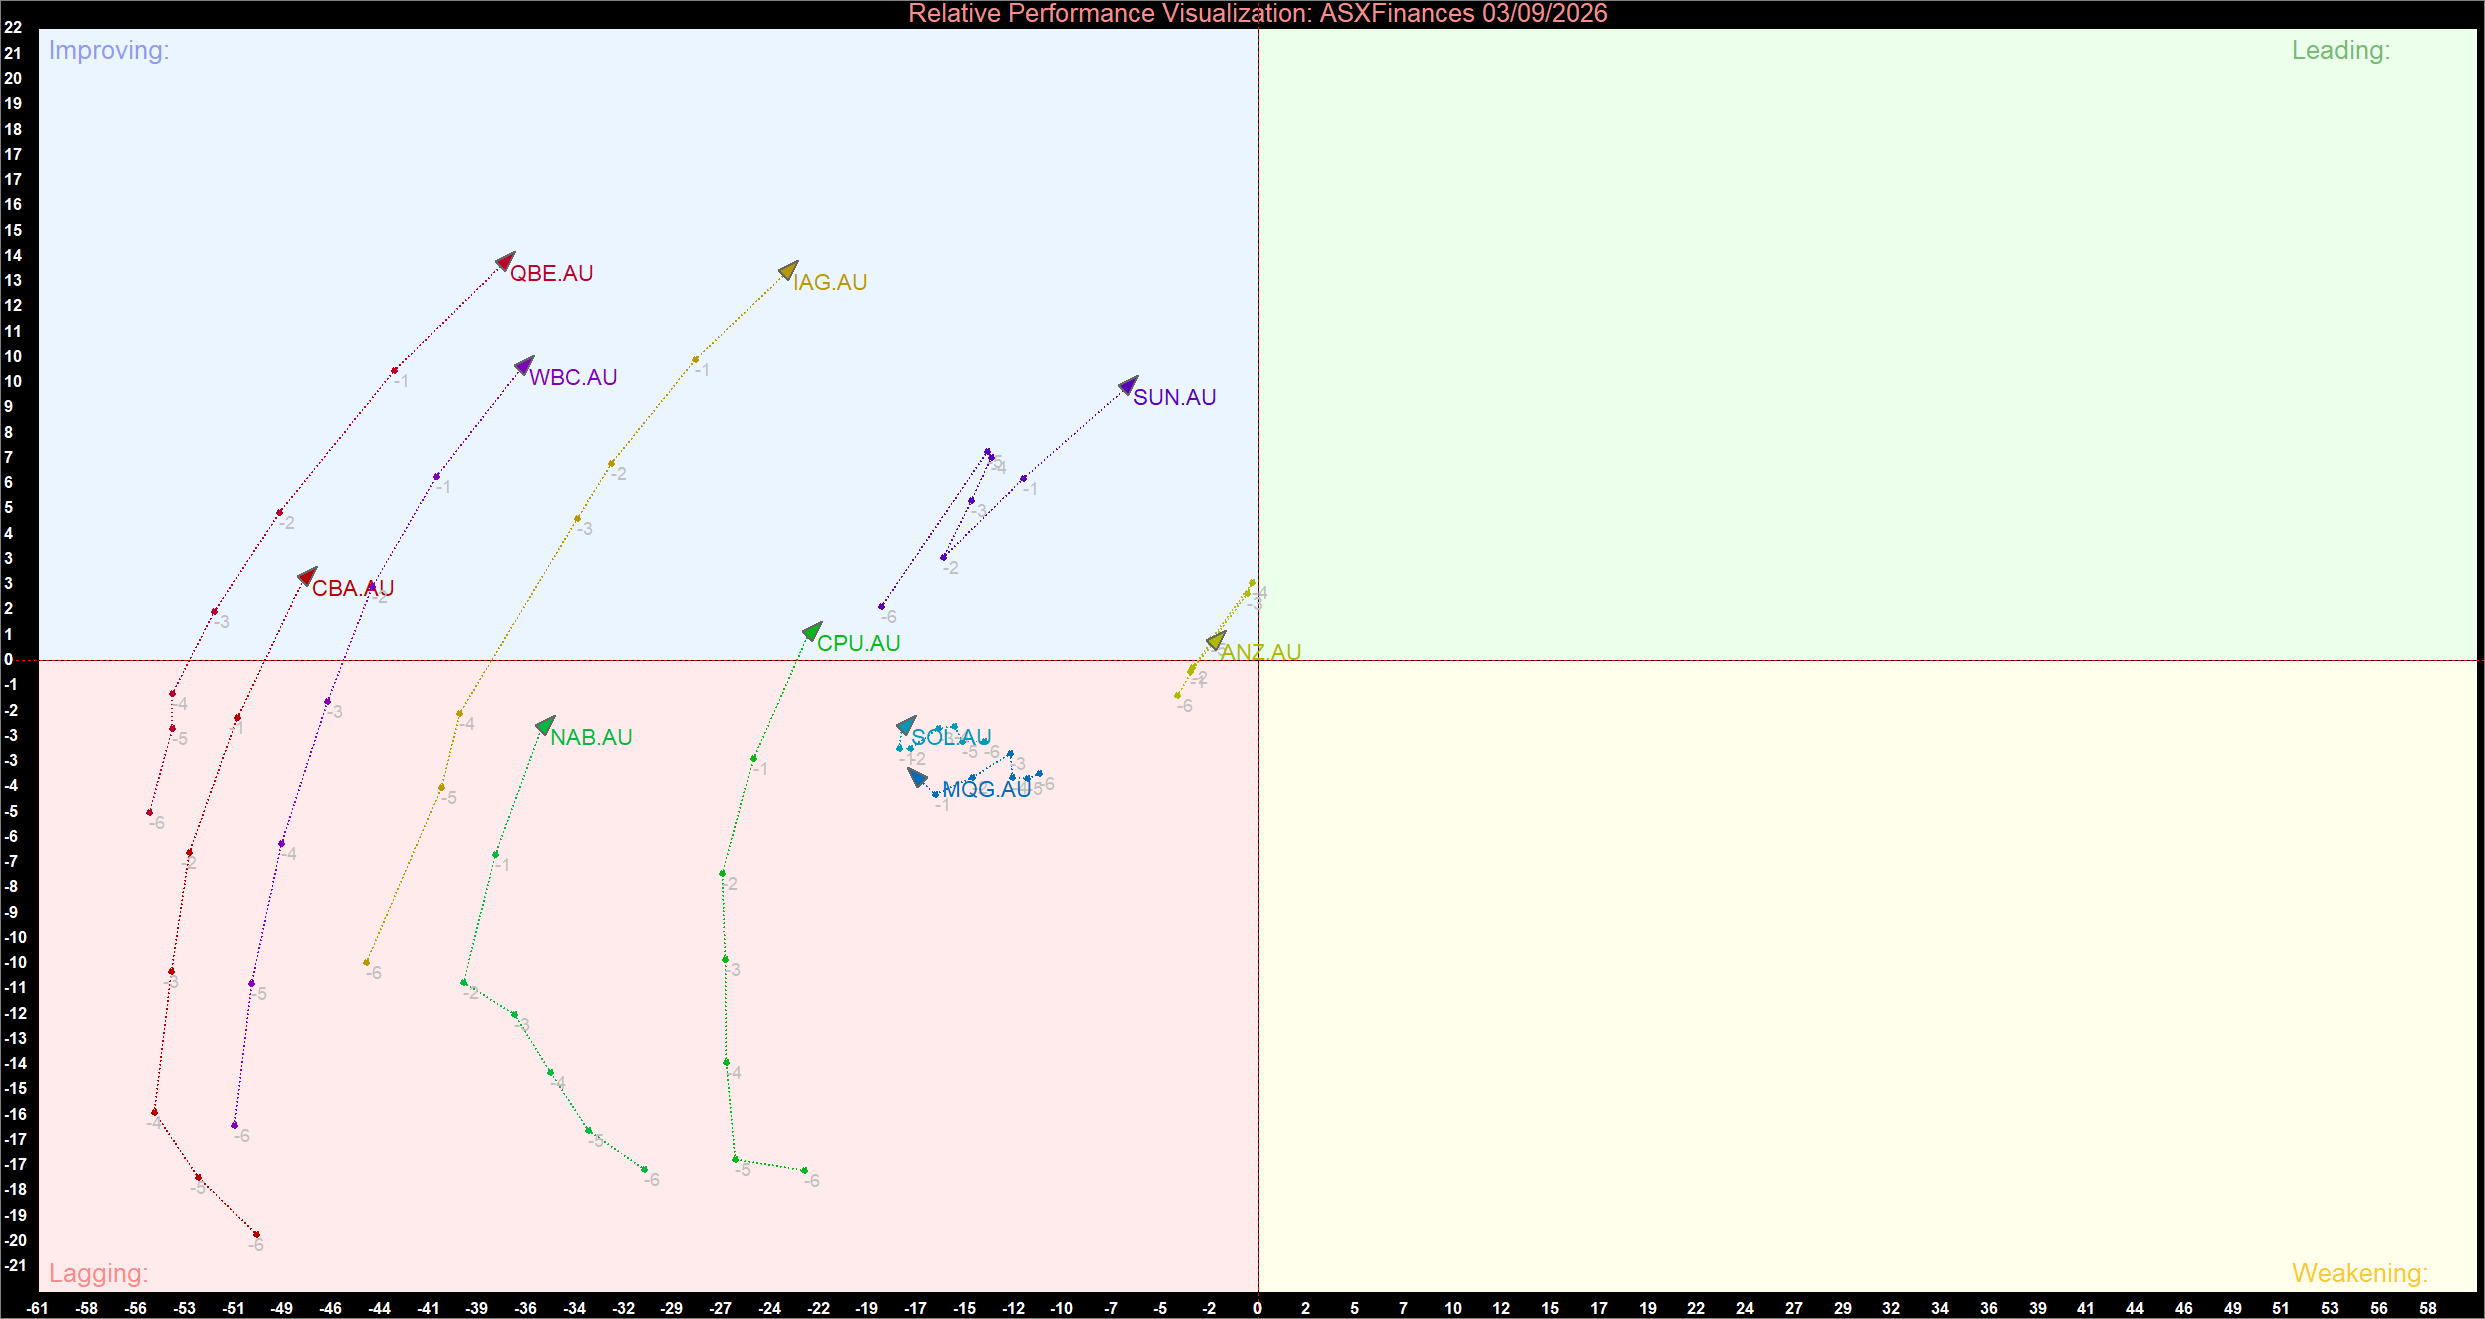
Financial Sector Relative Momentum Chart (at the closing price of 03/09/2026). Powered by: amibroker.com.
Improving Quadrant
ANZ, CBA, WBC, QBE, IAG, SUN and CPU are positioned in the Improving quadrant.
ANZ is positioned closest to the vertical RRG midline among the major banks and has the strongest daily performance, gaining 1.39%. Its position suggests that relative momentum is recovering and could potentially transition toward Leading if the trajectory continues into the upper-right area.
WBC and CBA are also in Improving. WBC gained 1.00%, while CBA edged 0.09% higher. Their positions indicate that relative momentum is strengthening, although neither has yet established a Leading position.
QBE, IAG and SUN are also located in Improving. Despite this constructive RRG positioning, their daily performances were negative, with QBE falling 0.44%, IAG declining 0.90% and SUN losing 0.36%. This divergence highlights the difference between short-term price performance and relative momentum: a stock can record a daily decline while still showing improving relative momentum on the RRG.
CPU is also positioned in Improving. However, it recorded the weakest daily performance in the group, falling 0.99%. Continued movement toward the upper-right would strengthen the improving signal, while a Reversal toward the lower-left could indicate renewed deterioration.
Lagging Quadrant
NAB, SOL and MQG remain in the Lagging quadrant.
NAB recorded a strong daily gain of 1.11%, making it the second-best performer among the selected stocks. However, its position below the horizontal RRG midline indicates that its relative momentum remains weaker despite the positive daily return.
SOL and MQG are also positioned in Lagging. SOL declined 0.23%, while MQG gained 0.26%. Their current locations indicate that relative performance has yet to recover sufficiently to generate an Improving signal.
For these stocks, sustained movement toward the centre of the RRG would provide an early indication that relative momentum is recovering. Continued movement away from the centre would reinforce their Lagging status.
Bottom Line
The latest RRG indicates that momentum across the selected ASX financial stocks is recovering but not yet established. Seven stocks - ANZ, CBA, WBC, QBE, IAG, SUN and CPU - are in Improving, while NAB, SOL and MQG remain in Lagging.
The major banks provide the strongest short-term performance signal, with ANZ, NAB and WBC gaining 1.39%, 1.11% and 1.00%, respectively. However, only ANZ, WBC and CBA are currently positioned in Improving, while NAB remains in Lagging despite its strong daily gain.
The key development to watch is whether the Improving group continues rotating toward the upper-right and eventually enters Leading. Conversely, renewed movement toward the lower-left, particularly among stocks already close to the quadrant boundary, would weaken the recovery signal. The chart therefore points to a broad but still developing improvement in financial-stock momentum rather than confirmed sector-wide leadership.


 Nov 12, 2026





 Please wait processing your request...