
 CA
 NZ
 UK
 US
 IND

 AU

 Share
 X (Formerly Twitter)
 Whatsapp
 Facebook
 LinkedIn
 Telegram
 Email This Article
 Copy Link
 Summarize with AI
 Chat GPT
 Perplexity

Highlights
- ARF’s property income rose 15% YoY to AUD 92.11 million in FY25.
- Statutory net profit of ARF increased 42% YoY to AUD 81.49 million and net operating profit grew 17% to AUD 73 million in FY25.
- FY2026 distribution guidance set at 19.25 cents per security, up 5.5%.
Arena REIT (ASX:ARF), a developer, owner, and manager of social infrastructure properties across Australia, has reported favourable financial performance for the full year ended 30 June 2025 (FY25).
ARF’s property income for FY25 increased 15% YoY to AUD 92.11 million, compared with AUD 80.22 million in FY24. Statutory net profit rose by 42% YoY to AUD 81.49 million, while net cash inflow from operating activities climbed 18.8% YoY to AUD 74.27 million.
Operating Performance Supported by Portfolio Growth
Arena REIT recorded a net operating profit of AUD 73 million for FY25, representing a 17% YoY increase from the previous year. Earnings per share increased 5.1% YoY to 18.55 cents, while distributions per share rose 4.9% YoY to 18.25 cents in FY25.
The performance was driven by income growth from contracted annual and market rent reviews. Acquisitions and development projects completed during FY2024 and FY2025 also contributed to the performance.
Key Positives and Risks
During FY25, the company recorded an increase in net margin to 74.9%, compared with 59% in FY24, alongside an improvement in return on equity to 6.3% from 4.8%.
However, the debt-to-equity ratio increased to 0.32x from 0.31x, while cash cycle days expanded to 37.7 days from 14.8 days. Key investment risks include climate-related factors, macroeconomic conditions, and competitive pressures.
Leadership Transition Announced
In a recent business update, Arena REIT announced that Rob de Vos will formally step down as Managing Director and Chief Executive Officer following a transition period.
Justin Bailey, currently Chief Investment Officer and CEO-designate, will assume the role of MD and CEO effective 14 November 2025.
FY2026 Outlook Remains Positive
ARF provided FY2026 distribution guidance of 19.25 cents per security, representing a 5.5% YoY increase on FY2025. The outlook is supported by confidence in the earnings and cash flow growth outlook.
As per the company, its portfolio continues to benefit from an attractive rent review structure with embedded income growth, alongside active portfolio management aimed at enhancing asset quality and extending weighted average lease expiry. A secured investment program and replenished development pipeline through FY26 and FY27, combined with increased borrowing capacity and relatively low gearing, support future growth opportunities.
Sustainability Progress and Emissions Targets
The company continues to advance toward its 2030 emissions-intensity target, with sustainability being a part of its investment strategy. Notably, in FY2025, the group achieved zero organisational Scope 1 and 2 emissions and installed solar renewable energy systems across 92% of the portfolio.
By the end of FY2024, Arena also delivered a 39% absolute reduction and a 47% intensity reduction in Scope 3 downstream leased-asset emissions, remaining on track toward its interim 2030 reduction target of 60–70%.
Share performance of ARF
ARF shares rose marginally by 0.28% to close at AUD 3.52 per share on 16 December 2025. Over the past year, the stock has declined 7.37% and is down 9.51% year-to-date. ARF has fallen 13.30% over the past three months and 10.20% over the last six months, while it is lower by 4.61% over the one-month period. The 52-week high for ARF is AUD 4.11, recorded on 30 December 2024, while the 52-week low is AUD 3.33, reached on 7 April 2025.
Support and Resistance Summary
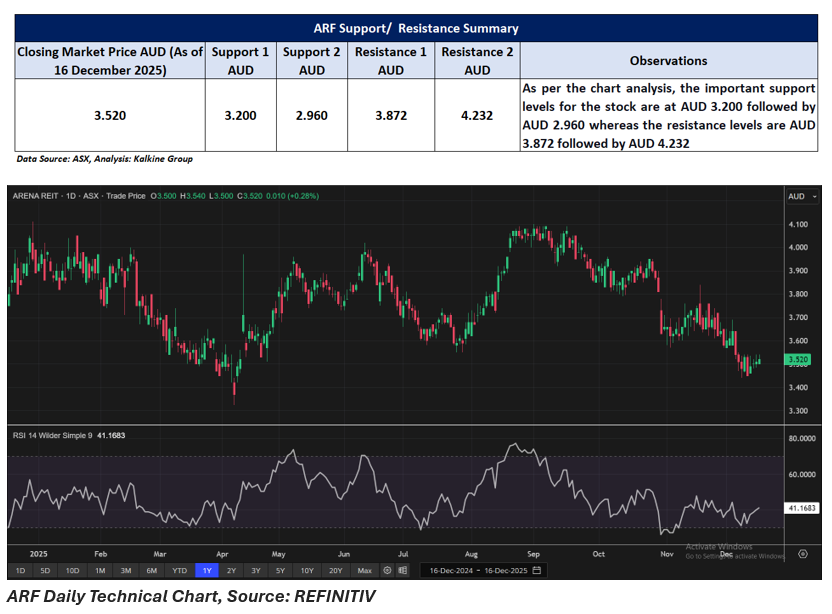
Note 1: Past performance is neither an Indicator nor a guarantee of future performance.
Note 2: The reference date for all price data, and currency, is 16 December 2025. The reference data in this report has been partly sourced from EODHD/Others.
Technical Indicators Defined:
Support: A level at which the stock prices tend to find support if they are falling, and a downtrend may take a pause backed by demand or buying interest. Support 1 refers to the nearby support level for the stock and if the price breaches the level, then Support 2 may act as the crucial support level for the stock.
Resistance: A level at which the stock prices tend to find resistance when they are rising, and an uptrend may take a pause due to profit booking or selling interest. Resistance 1 refers to the nearby resistance level for the stock and if the price surpasses the level, then Resistance 2 may act as the crucial resistance level for the stock.


 Nov 12, 2026





 Please wait processing your request...