
 CA
 NZ
 UK
 US
 IND

 AU

 Share
 X (Formerly Twitter)
 Whatsapp
 Facebook
 LinkedIn
 Telegram
 Email This Article
 Copy Link
 Summarize with AI
 Chat GPT
 Perplexity

Key Highlights
- AMP has completed a large-scale Inverse Head & Shoulders pattern on the weekly chart, confirming a major long-term bullish reversal.
- The company continues to simplify its business, strengthen its balance sheet, and focus on higher-quality wealth management and banking operations.
- The successful breakout above the long-term neckline near $2.01 suggests the multi-year accumulation phase has transitioned into a new structural uptrend.
- The pattern's measured-move projection points to a medium-to-long-term upside target of approximately $3.14.
After spending several years restructuring its operations and rebuilding investor confidence, AMP Limited (ASX: AMP) appears to have reached an important technical milestone. The stock has recently completed a large-scale Inverse Head & Shoulders reversal pattern that has been developing since 2020, breaking decisively above a neckline that had capped advances for more than five years. Such long-term accumulation structures often mark the transition from a prolonged bear market into the early stages of a new cyclical bull market.
The combination of improving business fundamentals and a confirmed multi-year technical breakout provides an increasingly constructive backdrop for AMP's long-term investment outlook.
The Wealth Management Transformation Story
AMP has undergone one of the most significant corporate transformations among Australia's diversified financial services companies over the past several years.
Following a period of operational challenges and strategic restructuring, the company has streamlined its business by divesting non-core assets, simplifying its operating structure, and strengthening its capital position. These initiatives have enabled management to concentrate on its core strengths in wealth management, retirement solutions, banking, and investment services.
Australia's ageing population and growing retirement savings pool continue to provide favourable long-term structural tailwinds for wealth managers. As more Australians transition into retirement, demand for financial advice, superannuation products, and retirement income solutions is expected to remain resilient.
AMP has also continued investing in improving its advice platform, digital capabilities, and customer experience. These initiatives aim to improve operational efficiency, deepen client engagement, and support sustainable earnings growth over the longer term.
While the business remains in a competitive industry, the completion of its restructuring programme places AMP in a stronger position to capitalise on future growth opportunities as investor confidence continues to recover.
Associated Risks
Despite the improving outlook, AMP continues to face several risks that investors should monitor.
Competition across Australia's wealth management and financial advice industries remains intense, placing ongoing pressure on fees and customer retention. Earnings may also be influenced by fluctuations in equity markets, as investment performance directly affects funds under management and associated fee income.
In addition, regulatory changes, higher compliance costs, and evolving consumer expectations continue to shape the financial services landscape. A sustained deterioration in investment markets or weaker economic conditions could also reduce client activity and negatively affect earnings growth.
Technical Outlook
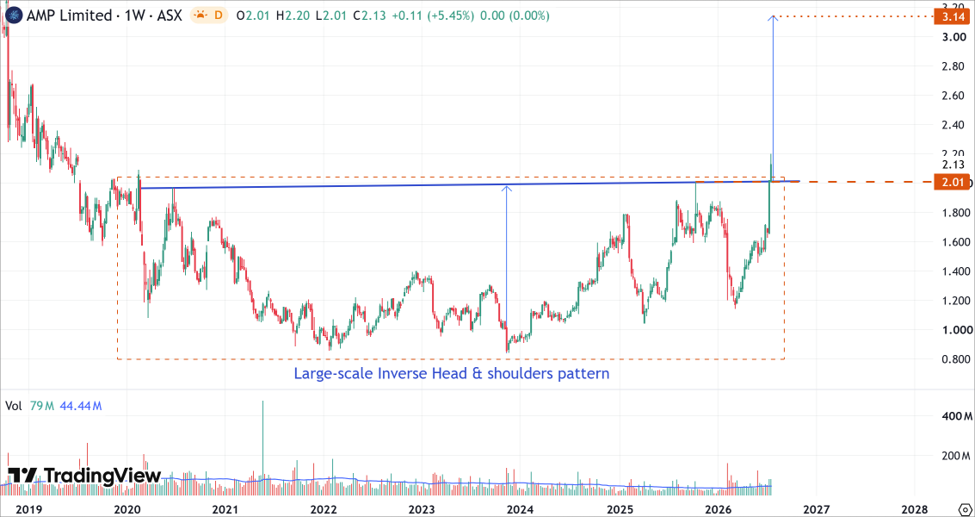
AMP's Weekly Price Chart (at the closing price of 23/07/2026). Powered by: tradingview.com.
- The weekly chart for AMP Limited highlights the completion of a significant large-scale Inverse Head & Shoulders accumulation pattern that has been developing since 2020.
- The pattern consists of a left shoulder formed during the 2020 decline, a head established at the 2022 bear market low, and a well-developed right shoulder that formed throughout 2023 to early 2026.
- The neckline resistance was positioned near $2.01, representing a major technical barrier that had capped the stock for more than five years.
- The recent breakout above $2.01 confirms the completion of the large-scale Inverse Head & Shoulders pattern, signalling that the multi-year accumulation phase has likely transitioned into a new long-term markup phase.
- Based on the height of the pattern, the measured-move projection indicates a medium-to-long-term upside target near $3.14.
- Before reaching the primary target, investors should monitor intermediate resistance levels around $2.40 and $2.70, where temporary profit-taking or consolidation may emerge following the recent breakout.
- On the downside, the former neckline near $2.01 is expected to become an important support level. As long as the stock remains above this breakout area, the longer-term bullish outlook is expected to remain intact.
Bottom Line
AMP Limited appears to have reached a pivotal point in its long-term recovery. After several years of corporate restructuring and share price consolidation, the stock has successfully completed a large-scale Inverse Head & Shoulders reversal pattern, confirming a decisive breakout above the major neckline resistance at $2.01.
The combination of improving business fundamentals and a confirmed multi-year technical breakout significantly strengthens the long-term investment outlook. While short-term pullbacks and profit-taking are normal following a major breakout, maintaining support above $2.01 would reinforce the bullish technical structure. If buying momentum persists, the measured-move projection suggests the stock could advance towards the long-term target near $3.14, with interim resistance likely around $2.40 and $2.70.


 Nov 12, 2026





 Please wait processing your request...