
 CA
 NZ
 UK
 US
 IND

 AU

 Share
 X (Formerly Twitter)
 Whatsapp
 Facebook
 LinkedIn
 Telegram
 Email This Article
 Copy Link
 Summarize with AI
 Chat GPT
 Perplexity

Image source: © 2025 Krish Capital Pty. Ltd.
Highlights
- AMA’s Q3FY25 revenue rose to AUD 249.6 million while EBITDA surged to AUD 21.1 million.
- Washington H. Soul Pattinson acquires 5.19% stake in AMA Group as of 30 June 2025.
- AMA Group forecasts FY25 normalized pre-AASB 16 EBITDA between AUD 58–62 million.
AMA Group Limited (ASX:AMA) is an ASX-listed company that operates a network of repair centres across New Zealand and Australia. Established in 2005, the company deals in the automotive aftercare market, offering vehicle accident repair services and automotive parts and accessories.
In the third quarter of the financial year 2025 (Q3FY25), the company’s revenue rose to AUD 249.6 million, compared to AUD 226.2 million in Q3FY24, primarily driven by a higher average repair price. During the reported period, AMA successfully integrated its site transition, resulting in increase in vehicle repair capacity.
Normalised EBITDA surged to AUD 21.1 million in Q3FY25, up from AUD 10.7 million in Q3FY24. Additionally, operating cash flow saw a positive turnaround of AUD 5.3 million compared to negative AUD 7.0 million in Q3FY24.
Business update
On 4 July 2025, AMA Group announced that Washington H. Soul Pattinson and Company Limited acquired a 5.19% stake in the company, reflecting increased institutional interest as of 30 June 2025.
Company Outlook
The company anticipates positive pre-AASB 16 EBITDA for FY25 and H2FY25. -The strategic focus remains on Prestige performance and the expansion of its TechRight and TrackRight networks. For FY25, AMA Group projects normalized pre-AASB 16 EBITDA in the range of AUD 58 million to AUD 62 million.
Stock Information
AMA shares were trading at AUD 0.099 per share during the trading session on 7 July 2025. AMA’s stock price has decreased by approximately 5.71% over the past month and risen about 73.68% over the last six months. In a year, the stock price has jumped almost 130.63%.
Support and Resistance Summary
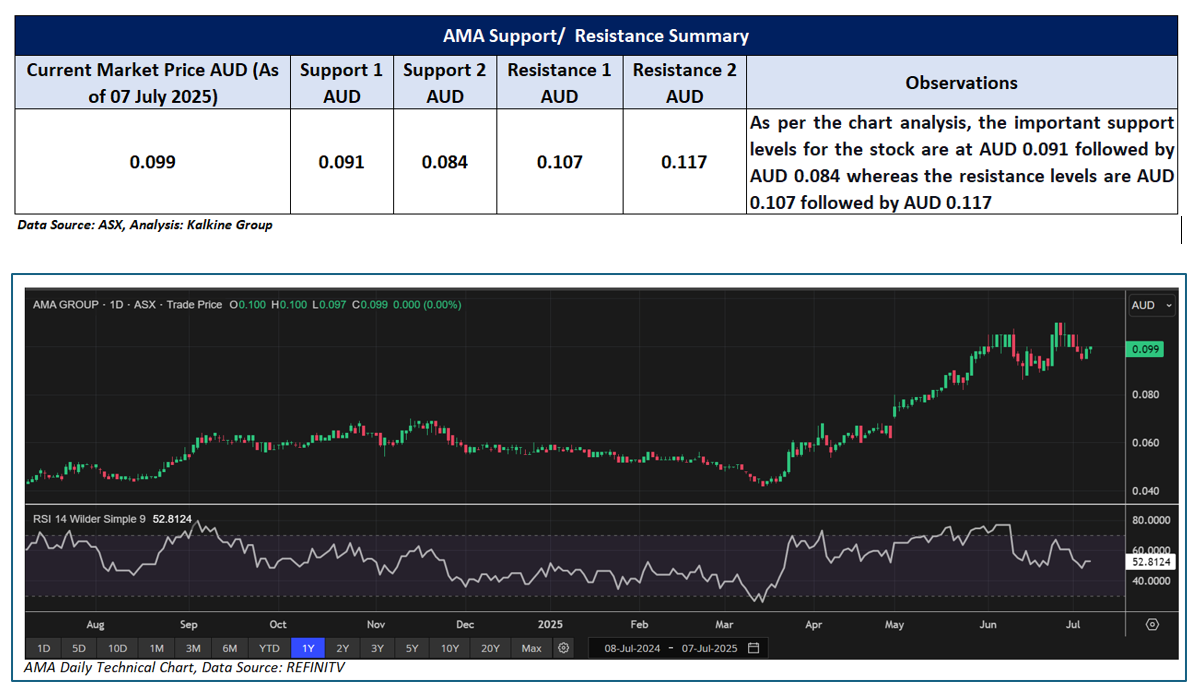
Note 1: Past performance is not a reliable indicator of future performance.
Note 2: The reference data for all price data, currency, technical indicators, support, and resistance levels is 7 July 2025. The reference data in this report has been partly sourced from EODHD/Others.
Technical Indicators Defined
Support: A level at which the stock prices tend to find support if they are falling, and a downtrend may take a pause backed by demand or buying interest. Support 1 refers to the nearby support level for the stock and if the price breaches the level, then Support 2 may act as the crucial support level for the stock.
Resistance: A level at which the stock prices tend to find resistance when they are rising, and an uptrend may take a pause due to profit booking or selling interest. Resistance 1 refers to the nearby resistance level for the stock and if the price surpasses the level, then Resistance 2 may act as the crucial resistance level for the stock.


 Nov 12, 2026





 Please wait processing your request...