
 CA
 NZ
 UK
 US
 IND

 AU

 Share
 X (Formerly Twitter)
 Whatsapp
 Facebook
 LinkedIn
 Telegram
 Email This Article
 Copy Link
 Summarize with AI
 Chat GPT
 Perplexity

Key Highlights
- MYS has completed a large-scale Inverse Head & Shoulders pattern following several years of consolidation.
- The share price has broken above the neckline around $4.74, strengthening the bullish technical structure.
- MYS closed at $5.09 on the updated weekly chart, remaining comfortably above the breakout level.
- The former neckline around $4.74 is now an important potential support level during any pullback.
- The chart-based measured-move target is approximately $6.57, suggesting further upside if the breakout is sustained.
- Intermediate resistance levels are located around $5.44 and $6.07, based on previous price structure.
- The rising price structure and breakout from the long-term base indicate a potentially significant medium-term trend reversal.
MyState Limited (ASX: MYS) has reached an important technical inflection point after an extended period of consolidation. The Weekly Chart shows a large-scale Inverse Head & Shoulders pattern, with the share price breaking above the neckline around $4.74. The breakout strengthens the bullish technical outlook and opens the potential for a further medium-term advance.
Associated Risks
The bullish outlook depends on MYS maintaining its position above the former neckline around $4.74. A sustained move below this level could weaken the breakout signal and increase the risk of the share price returning to its previous consolidation range.
The resistance levels around $5.44 and $6.07 could also generate selling pressure as the price advances. A failure to break through these levels could result in a period of consolidation before the next directional move.
The broader long-term structure remains important. The head of the Inverse Head & Shoulders pattern was formed near $3.00, making the lower portion of the previous consolidation a significant longer-term support area if the current breakout fails.
Technical Outlook
The weekly chart shows MYS breaking above the neckline of a large-scale Inverse Head & Shoulders pattern, strengthening the bullish technical outlook and pointing towards further upside.
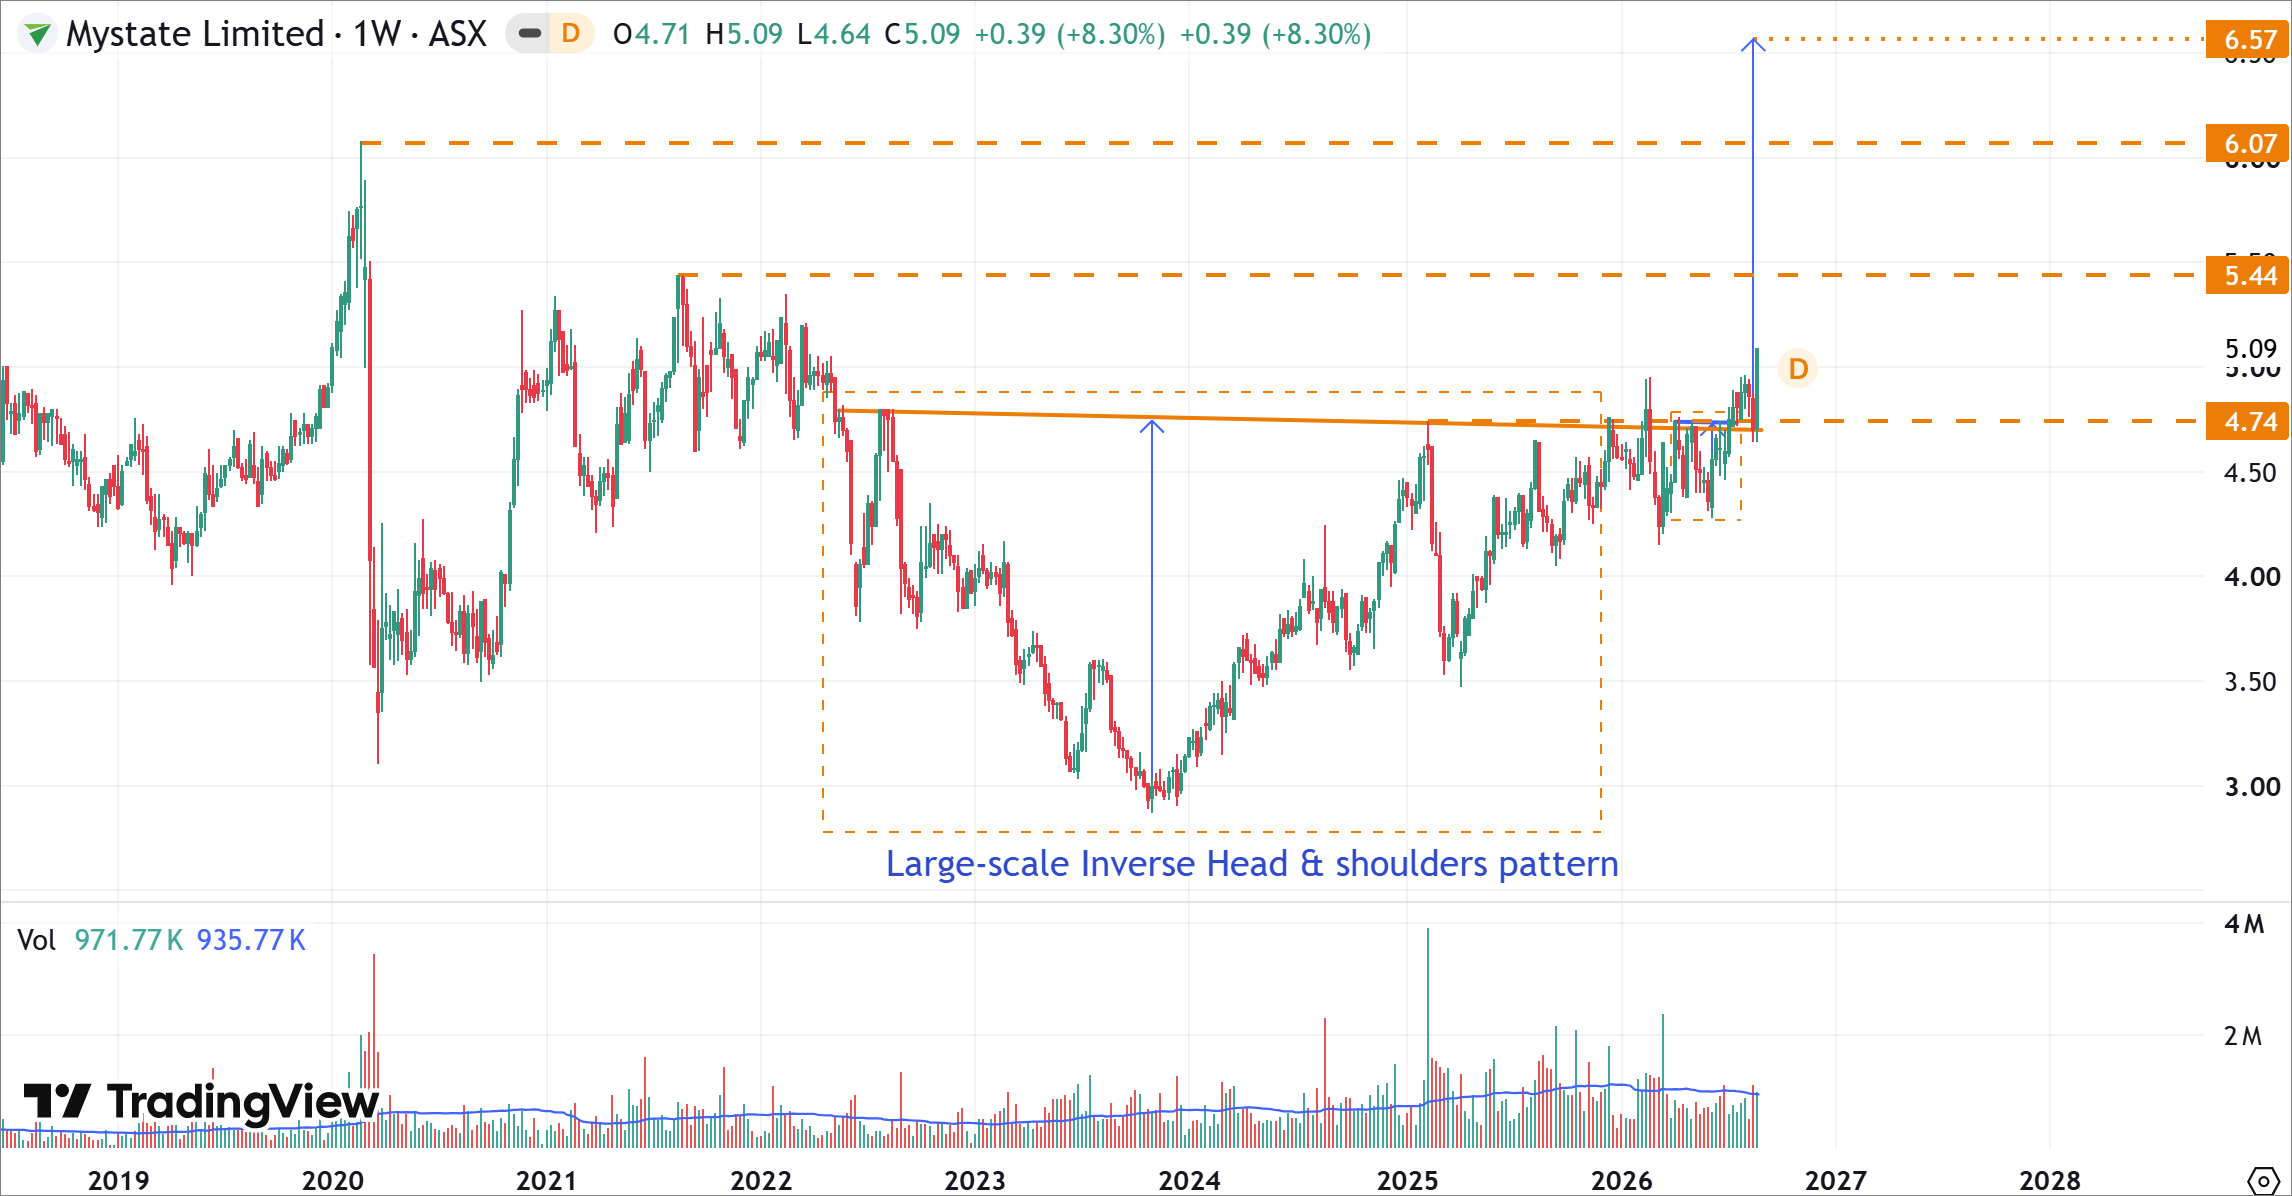
MYS's Weekly Price Chart (at the closing price of 25/08/2026). Powered by: tradingview.com.
- MYS has completed a large-scale Inverse Head & Shoulders pattern following an extended period of consolidation.
- The share price has broken above the neckline around $4.74, confirming an important bullish technical development.
- The latest weekly candle closed at $5.09, placing the share price above the former resistance level.
- The neckline around $4.74 now becomes the key potential support level.
- The next significant resistance is positioned around $5.44, followed by $6.07.
- The measured-move projection from the Inverse Head & Shoulders pattern points towards approximately $6.57.
- From the $4.74 neckline, the $6.57 target represents potential upside of approximately 38.6%.
- Sustained trading above the neckline would strengthen the breakout structure, while a decisive move back below $4.74 could signal a failed breakout.
Bottom Line
MYS has reached a significant technical inflection point after completing a large-scale Inverse Head & Shoulders pattern on the weekly chart. The breakout above the $4.74 neckline has strengthened the bullish structure and suggests that the long-term consolidation phase may be transitioning into a new upward trend.
The key level to monitor is now $4.74, which could act as support during any subsequent pullback. A sustained move above this level would keep the bullish breakout structure intact, while resistance around $5.44 and $6.07 represents the next hurdles.
If the breakout remains valid, the pattern's measured-move projection points towards approximately $6.57, providing a substantial potential upside objective from the current level.


 Nov 12, 2026





 Please wait processing your request...