…
Southern Copper Corporation engages in mining, exploring, smelting, and refining copper and other minerals in Peru, Mexico, Argentina, Ecuador, and Chile. The company is involved in the mining, milling, and flotation of copper ore to produce copper and molybdenum concentrates; smelting of copper concentrates to produce blister and anode copper; refining of anode copper to produce copper cathodes; production of molybdenum concentrate and sulfuric acid; production of refined silver, gold, and other materials; and mining and processing of zinc, copper, molybdenum, silver, gold, and lead. It operates the Toquepala and Cuajone open-pit mines, and a smelter and refinery in Peru; and La Caridad, an open-pit copper mine, as well as a copper ore concentrator, a SX-EW plant, a smelter, refinery, and a rod plant in Mexico. The company also operates Buenavista, an open-pit copper mine, as well as two copper concentrators and two operating SX-EW plants in Mexico. In addition, it operates five underground mines that produce zinc, lead, copper, silver, and gold; a coal mine that produces coal and coke; and a zinc refinery. The company has interests in 493,117 hectares of exploration concessions in Peru and Mexico; 239,077 hectares of exploration concessions in Argentina; 30,568 hectares of exploration concessions in Chile; and 7,299 hectares of exploration concessions in Ecuador. Southern Copper Corporation was incorporated in 1952 and is based in Phoenix, Arizona. Southern Copper Corporation operates as a subsidiary of Americas Mining Corporation.

Source: TradingView
The charts and visual representations are sourced from TradingView through embedded widgets. For any issues with chart display, please visit the TradingView website
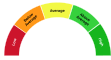
A unique technical analysis driven score developed by Kalkine showing momentum in stock prices based on select technical indicators identified.
Southern Copper Corporation is an integrated copper producer that operates large mines, smelters and refineries in Peru and Mexico. Long-term growth may be supported by rising copper demand from electrification and renewables, its sizable reserve base and vertical integration, and investors may find exposure to a low-cost producer useful for participation in secular copper trends.
Key risks include commodity-price volatility, operational and permitting disruptions, environmental and social conflicts in jurisdictions where it operates, and significant capital intensity for sustaining and expanding production.
Note: The summary and risk score provided above is created by AI and should not be construed as a recommendation of Kalkine.
| Breakdown | 2022-12-31 | 2021-12-31 | 2020-12-31 | 2019-12-31 | 2018-12-31 |
|---|---|---|---|---|---|
| Type | yearly | yearly | yearly | yearly | yearly |
| Date | 2022-12-31 | 2021-12-31 | 2020-12-31 | 2019-12-31 | 2018-12-31 |
| Income before tax | 4263.90M | 5696.80M | 2745.80M | 2426.50M | 2589.40M |
| Minority interest | -9.50M | -14.10M | 7.40M | 47.90M | 5.20M |
| Net income | 2638.50M | 3397.10M | 1570.40M | 1485.80M | 1543.00M |
| Selling general administrative | 125.00M | 125.20M | 126.00M | 131.80M | 102.60M |
| Gross profit | 4602.50M | 6233.70M | 3279.50M | 2914.80M | 3013.40M |
| Reconciled depreciation | 796.30M | 806.00M | 775.60M | 764.40M | 674.30M |
| Ebit | 4435.80M | 6065.10M | 3120.70M | 2753.00M | 2866.50M |
| Ebitda | 5400.30M | 6859.90M | 3888.00M | 3531.60M | 3540.80M |
| Depreciation and amortization | 964.50M | 794.80M | 767.30M | 778.60M | 674.30M |
| Non operating income net other | - | 2.40M | -1.90M | - | -2.40M |
| Operating income | 4435.80M | 6065.10M | 3120.70M | 2753.00M | 2881.20M |
| Other operating expenses | 5612.10M | 4869.00M | 4864.20M | 4532.60M | 4215.50M |
| Interest expense | 340.10M | 357.10M | 366.60M | 340.70M | 277.10M |
| Tax provision | 1612.20M | 2299.20M | 1174.40M | 945.30M | 1053.50M |
| Interest income | 35.00M | 7.20M | 19.20M | 21.20M | 16.00M |
| Net interest income | -305.10M | -349.90M | -347.40M | -319.50M | -261.10M |
| Extraordinary items | - | - | - | - | -30.90M |
| Non recurring | - | 43.40M | 32.60M | - | 29.60M |
| Income tax expense | 1612.20M | 2299.20M | 1174.40M | 945.30M | 1053.50M |
| Total revenue | 10047.90M | 10934.10M | 7984.90M | 7285.60M | 7096.70M |
| Total operating expenses | 166.70M | 168.60M | 158.80M | 161.80M | 132.20M |
| Cost of revenue | 5445.40M | 4700.40M | 4705.40M | 4370.80M | 4083.30M |
| Total other income expense net | -171.90M | -368.30M | -374.90M | -326.50M | -30.70M |
| Net income from continuing ops | 2648.00M | 3411.20M | 2809.30M | 1491.90M | 2640.90M |
| Net income applicable to common shares | 2638.50M | 3397.10M | 1570.40M | 1485.80M | 1543.00M |
| Breakdown | 2022-12-31 | 2021-12-31 | 2020-12-31 | 2019-12-31 | 2018-12-31 |
|---|---|---|---|---|---|
| Type | yearly | yearly | yearly | yearly | yearly |
| Date | 2022-12-31 | 2021-12-31 | 2020-12-31 | 2019-12-31 | 2018-12-31 |
| Total assets | 17277.40M | 18297.60M | 16667.10M | 16407.40M | 14484.80M |
| Intangible assets | 13.20M | 13.80M | 15.90M | 19.80M | 17.50M |
| Other current assets | 422.00M | 231.20M | 134.00M | 198.60M | 117.20M |
| Total liab | 9130.50M | 10089.80M | 9391.10M | 9549.20M | 7871.90M |
| Total stockholder equity | 8084.20M | 8149.20M | 7224.80M | 6810.30M | 6567.50M |
| Deferred long term liab | - | 118.30M | 159.40M | - | 202.60M |
| Other current liab | 500.80M | 1358.40M | 699.90M | 478.40M | 542.90M |
| Common stock | 3498.50M | 3462.90M | 3450.30M | 3433.70M | 3402.60M |
| Capital stock | 3498.50M | 8.80M | 8.80M | 8.80M | 8.80M |
| Retained earnings | 7702.30M | 7769.70M | 6846.40M | 6435.60M | 6186.90M |
| Other liab | 869.50M | 749.50M | 563.80M | 553.90M | 498.40M |
| Good will | 41.90M | 41.90M | 41.90M | 41.90M | 41.90M |
| Other assets | -20.00M | 1639.20M | 11988.00M | 1545.00M | 1452.50M |
| Cash | 2069.70M | 3002.00M | 2183.60M | 1925.10M | 844.60M |
| Total current liabilities | 1235.70M | 2250.00M | 1374.70M | 1476.50M | 1216.30M |
| Net debt | 5032.90M | 4388.00M | 5269.00M | 5993.50M | 5115.50M |
| Short term debt | 77.30M | 299.70M | 70.60M | 399.80M | - |
| Short long term debt | - | 299.70M | - | 399.80M | - |
| Short long term debt total | 7102.60M | 7390.00M | 7452.60M | 7918.60M | 5960.10M |
| Other stockholder equity | -10809.90M | -10843.70M | -9909.90M | -9484.50M | -9206.50M |
| Property plant equipment | 10448.00M | 10380.70M | 10583.70M | 10417.40M | 10581.20M |
| Total current assets | 5187.70M | 6139.60M | 4815.20M | 4184.70M | 3180.80M |
| Long term investments | 110.80M | 115.40M | 114.30M | 111.90M | 103.60M |
| Net tangible assets | 7949.50M | 8011.10M | 7081.80M | 6661.90M | 6419.70M |
| Short term investments | 208.30M | 486.90M | 410.80M | 80.70M | 213.80M |
| Net receivables | 1473.80M | 1446.60M | 1136.60M | 911.80M | 972.50M |
| Long term debt | 6251.20M | 6247.90M | 6544.20M | 6541.00M | 5960.10M |
| Inventory | 1013.90M | 972.90M | 950.20M | 1068.50M | 1032.70M |
| Accounts payable | 657.60M | 591.90M | 604.20M | 598.30M | 673.40M |
| Noncontrolling interest in consolidated entity | - | 58.60M | 51.20M | - | 45.40M |
| Accumulated other comprehensive income | 7693.30M | 7760.30M | 6838.00M | 6425.50M | 6184.50M |
| Common stock total equity | - | 8.80M | 8.80M | 8.80M | 8.80M |
| Retained earnings total equity | - | 7769.70M | 6846.40M | - | 6186.90M |
| Treasury stock | - | -3074.00M | -3063.50M | -3048.90M | -3019.60M |
| Non currrent assets other | 1158.90M | 1207.60M | 1196.20M | 1361.10M | 1247.90M |
| Deferred long term asset charges | - | - | - | - | 400.90M |
| Non current assets total | 12109.70M | 12158.00M | 11851.90M | 12222.70M | 11304.00M |
| Capital lease obligations | 774.10M | 842.40M | 908.40M | 1046.40M | - |
| Long term debt total | - | 6247.90M | 6544.20M | 6541.00M | 5960.10M |
| Breakdown | 2022-12-31 | 2021-12-31 | 2020-12-31 | 2019-12-31 | 2018-12-31 |
|---|---|---|---|---|---|
| Type | yearly | yearly | yearly | yearly | yearly |
| Date | 2022-12-31 | 2021-12-31 | 2020-12-31 | 2019-12-31 | 2018-12-31 |
| Investments | -666.80M | -76.10M | -330.10M | -574.00M | -163.30M |
| Change to liabilities | -718.00M | 558.20M | 313.80M | -184.90M | 117.80M |
| Total cashflows from investing activities | -666.80M | -972.90M | -915.80M | -574.00M | -1296.20M |
| Net borrowings | -300.00M | -300.00M | -400.00M | 987.30M | 987.30M |
| Total cash from financing activities | -3011.00M | -2480.20M | -1563.10M | -262.20M | -1083.40M |
| Change to operating activities | -79.10M | 190.70M | 483.60M | -62.90M | 28.40M |
| Net income | 2648.00M | 3411.20M | 1577.80M | 1491.90M | 1548.20M |
| Change in cash | -932.30M | 818.40M | 258.50M | 1080.50M | -160.20M |
| Begin period cash flow | 3002.00M | 2183.60M | 1925.10M | 844.60M | 1004.80M |
| End period cash flow | 2069.70M | 3002.00M | 2183.60M | 1925.10M | 844.60M |
| Total cash from operating activities | 2802.50M | 4292.40M | 2783.40M | 1911.90M | 2235.10M |
| Depreciation | 796.30M | 806.00M | 775.60M | 764.40M | 674.30M |
| Other cashflows from investing activities | 3.20M | -4.50M | 6.50M | 0.40M | -11.50M |
| Dividends paid | 2705.80M | 2473.80M | 1159.60M | 1236.90M | 1082.30M |
| Change to inventory | -7.70M | 4.70M | 223.60M | -88.70M | -190.80M |
| Change to account receivables | -35.40M | -289.80M | -236.00M | -10.50M | 68.30M |
| Sale purchase of stock | - | - | - | - | 0.00M |
| Other cashflows from financing activities | -5.20M | -6.40M | -3.50M | 974.70M | -1.10M |
| Change to netincome | 207.90M | -101.40M | -53.50M | 8.70M | -11.10M |
| Capital expenditures | 948.50M | 892.30M | 592.20M | 707.50M | 1121.40M |
| Change receivables | - | -289.80M | -236.00M | - | 68.30M |
| Cash flows other operating | - | -82.40M | 182.30M | - | 28.40M |
| Cash and cash equivalents changes | - | 839.30M | 304.50M | - | -144.50M |
| Change in working capital | -838.90M | 190.70M | 483.60M | -347.00M | 22.60M |
| Stock based compensation | - | -806.00M | - | - | -674.30M |
| Other non cash items | 79.80M | 816.80M | 785.50M | 788.00M | 714.70M |
| Free cash flow | 1854.00M | 3400.10M | 2191.20M | 1204.40M | 1113.70M |
Sector: Basic Materials Industry: Copper
|
Stock Name
|
Change
(USD) |
Price
(USD) |
Trailing
PE (x) |
Forward
PE (x) |
Price Sales
TTM (x) |
Price to Book Value (x)
|
Enterprise Value
to Revenue (x) |
Enterprise Value
to EBITDA (x) |
|---|---|---|---|---|---|---|---|---|
| SCCO Southern Copper Corporation |
2.34 1.16% |
203.92 | 23.55 | 50.25 | 6.18 | 8.31 | 6.64 | 12.17 |
| FCX Freeport-McMoran Copper & Gold Inc |
0.23 0.32% |
72.31 | 45.97 | 26.53 | 3.75 | 5.14 | 4.00 | 11.55 |
| ANFGF Antofagasta PLC |
0.01 0.01% |
50.23 | 39.93 | 33.33 | 6.16 | 4.90 | 6.08 | 10.04 |
| TCKRF Teck Resources Limited |
- -% |
65.55 | 18.93 | 17.73 | 2.44 | 1.71 | 3.50 | 7.52 |
| TECK Teck Resources Ltd Class B |
-0.46 0.69% |
66.05 | 17.62 | 16.92 | 2.27 | 1.59 | 3.42 | 7.35 |
Southern Copper Corporation engages in mining, exploring, smelting, and refining copper and other minerals in Peru, Mexico, Argentina, Ecuador, and Chile. The company is involved in the mining, milling, and flotation of copper ore to produce copper and molybdenum concentrates; smelting of copper concentrates to produce blister and anode copper; refining of anode copper to produce copper cathodes; production of molybdenum concentrate and sulfuric acid; production of refined silver, gold, and other materials; and mining and processing of zinc, copper, molybdenum, silver, gold, and lead. It operates the Toquepala and Cuajone open-pit mines, and a smelter and refinery in Peru; and La Caridad, an open-pit copper mine, as well as a copper ore concentrator, a SX-EW plant, a smelter, refinery, and a rod plant in Mexico. The company also operates Buenavista, an open-pit copper mine, as well as two copper concentrators and two operating SX-EW plants in Mexico. In addition, it operates five underground mines that produce zinc, lead, copper, silver, and gold; a coal mine that produces coal and coke; and a zinc refinery. The company has interests in 493,117 hectares of exploration concessions in Peru and Mexico; 239,077 hectares of exploration concessions in Argentina; 30,568 hectares of exploration concessions in Chile; and 7,299 hectares of exploration concessions in Ecuador. Southern Copper Corporation was incorporated in 1952 and is based in Phoenix, Arizona. Southern Copper Corporation operates as a subsidiary of Americas Mining Corporation.
1440 East Missouri Avenue, Phoenix, AZ, United States, 85014
602 264 1375
15018
| Name | Title | Year Born |
|---|---|---|
| Mr. Oscar Gonzalez Rocha | Pres, CEO & Director | 1938 |
| Mr. Raul Jacob Ruisanchez | VP of Fin., Treasurer & CFO | 1958 |
| Ms. Lina A. Vingerhoets Vilca | Comptroller | 1961 |
| Mr. Edgard Corrales Aguilar | VP of Exploration | 1956 |
| Mr. Julian Jorge Lazalde Psihas | Sec. | 1968 |
| Mr. Victor Pedraglio | Mang. of Financial Planning & Investor Relations | NA |
| Mr. Andres Carlos Ferrero Ghislieri | Gen. Counsel | 1969 |
Disclaimer - (*)This information, including any data, is sourced from Unicorn Data Services SAS, trading as EOD Historical Data (“EODHD”) on an ‘as is’ basis, using their API. We cannot guarantee the completeness or validity of the information and data provided on this page, as well as via the API. In some cases, the data may include analyst ratings or recommendations sourced through the EODHD API, which are intended solely for general information purposes.
This information does not consider your personal objectives, financial situation, or needs. Kalkine is not liable for any errors or omissions in the information provided or for any actions taken in reliance on it. You should seek advice from a financial adviser, stockbroker or other professional adviser (including taxation and legal advice) as necessary before acting on this information.