One NYSE- Listed Marine Stock with Long-term Outlook: Safe Bulkers Inc
Section 1: Company Overview and Fundamentals
1.1 Company Overview:
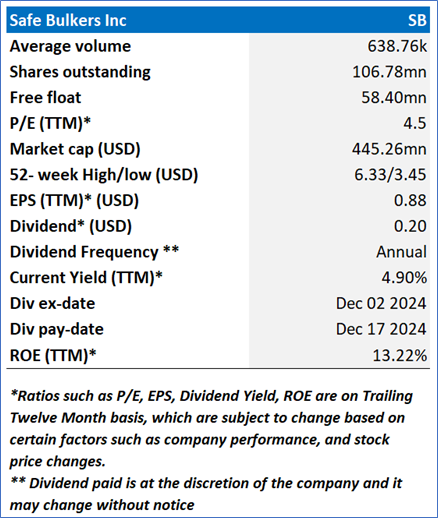
Safe Bulkers, Inc. (NYSE: SB) is a holding company. The Company's principal business is the acquisition, ownership and operation of drybulk vessels. The Company's vessels operate across the world, carrying drybulk cargo for the consumers of marine drybulk transportation services. The Company is an international provider of marine drybulk transportation services, transporting bulk cargoes, particularly coal, grain and iron ore, along shipping routes across the world.
Kalkine’s Dividend Income Report covers the Company Overview, Key positives & negatives, Investment summary, Key investment metrics, Top 10 shareholding, Business updates and insights into company recent financial results, Key Risks & Outlook, Price performance and technical summary, Target Price, and Recommendation on the stock.
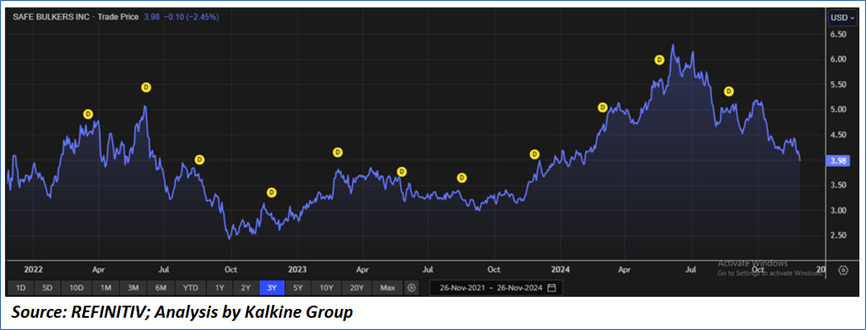
Price Performance:
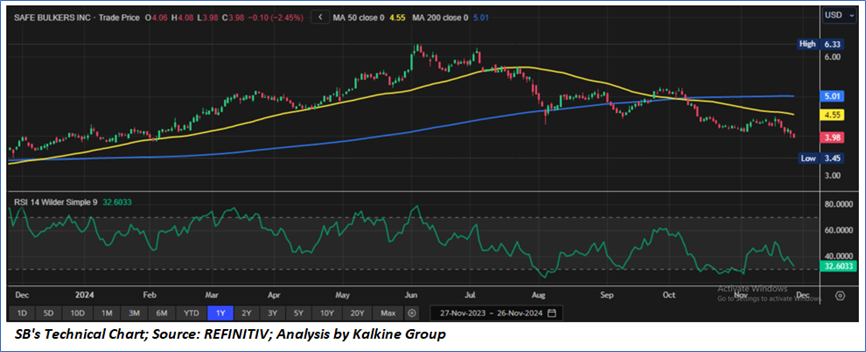
- SB's share price has corrected by 21.96% in the past three months. Similarly, in the long term, the stock has corrected by 27.23% over the past six months.
- The stock is leaning towards the lower band of its 52-week range of USD 6.33 and 52-week low price of USD 3.45, with the current price broken near an important support area of USD 3.50-USD 3.80, therefore an expectation of upward movement if the levels sustain.
- The price is currently below both its short-term (50-day) SMA and long-term (200-day) SMA, with the current RSI of 32.60, downward trending nearing oversold zone, with expectations of upward movement.
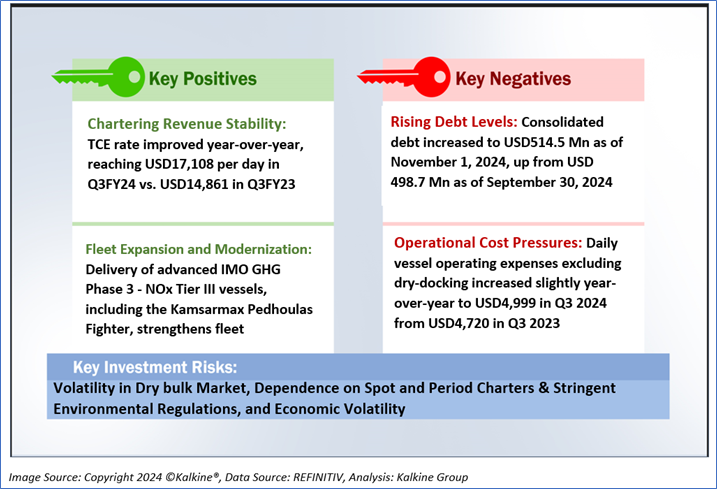
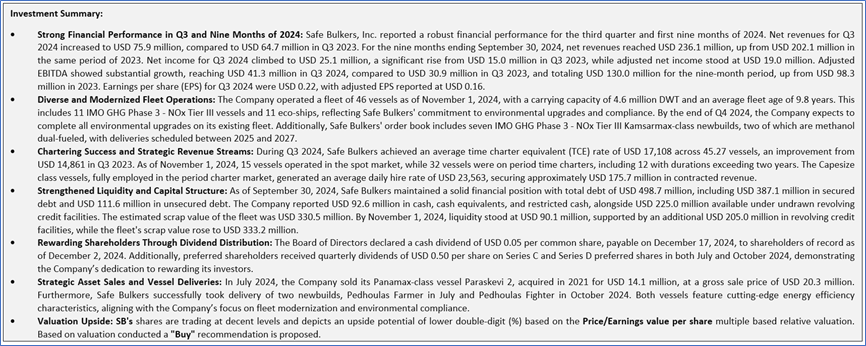
1.2 The Key Positives, Negatives, and Investment summary
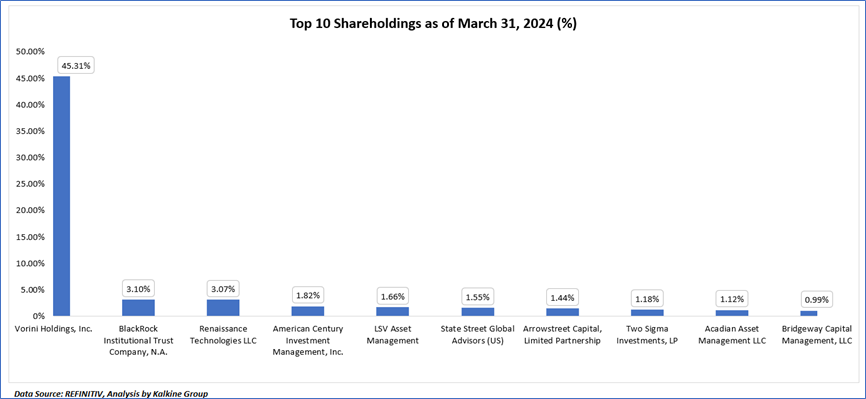
1.3 Top 10 shareholders:
The top 10 shareholders together form ~61.24% of the total shareholding, signifying concentrated shareholding. Vorini Holdings, Inc. and Renaissance Technologies LLC, are the biggest shareholders, holding the maximum stake in the company at ~45.31% and ~3.10%, respectively.
1.4 Dividend payments with impressive dividend yield:
Safe Bulkers Inc. has a history of paying dividends on both its common stock and Series C & D preferred shares. The Company's dividend policy remains subject to the discretion of its Board of Directors, with no assurance of future cash dividend declarations. On November 13, 2024, a cash dividend of USD 0.05 per common share was announced, payable on December 17, 2024, to shareholders of record as of December 2, 2024. Earlier in October and July 2024, the Board declared cash dividends of USD 0.50 per share on Series C and Series D preferred shares for respective periods, paid on October 30, 2024, and July 30, 2024. Additionally, a USD 0.05 cash dividend on common stock, declared in July, was paid on September 5, 2024. The Board's decisions on dividends are influenced by the Company’s earnings, fleet profile, financial health, liquidity, strategic priorities, legal provisions, debt covenants, and prevailing economic conditions.
1.5 Key Metrics
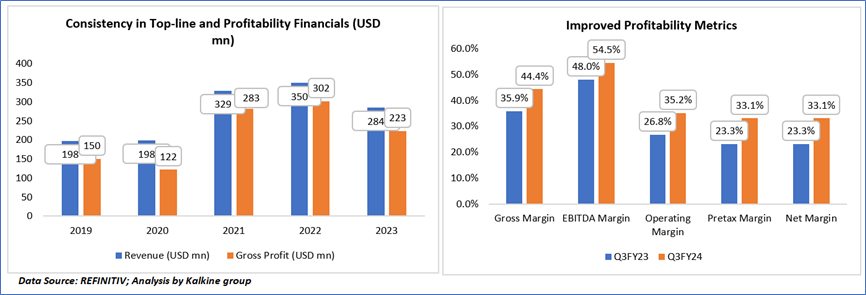
The company reported its financial performance over the past five years (2019-2023), with notable variations in both revenue and gross profit. In 2019 and 2020, revenue remained stable at USD 198 million, but it experienced substantial growth in 2021, rising to USD 329 million, and further increased to USD 350 million in 2022. However, revenue declined to USD 284 million in 2023. Similarly, gross profit followed a similar trend, peaking at USD 302 million in 2022, after standing at USD 150 million in 2019, and USD 122 million in 2020. Despite the revenue decline in 2023, the gross profit stood at USD 223 million.
In terms of profitability margins, there was a marked improvement in the third quarter of fiscal year 2024 (Q3FY24) compared to the same period in fiscal year 2023 (Q3FY23). Gross margin increased from 35.9% in Q3FY23 to 44.4% in Q3FY24, and EBITDA margin rose from 48.0% to 54.5%. Operating margin also saw a significant increase, moving from 26.8% in Q3FY23 to 35.2% in Q3FY24. Additionally, both pretax and net margins improved substantially, growing from 23.3% in Q3FY23 to 33.1% in Q3FY24, indicating enhanced overall profitability during this period.
Section 2: Business Updates and Financial Highlights
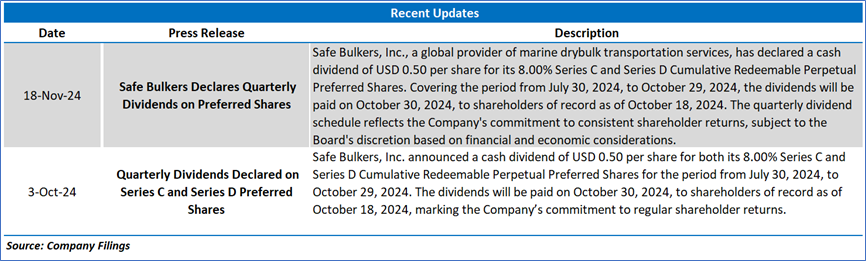
2.1 Recent Updates:
The below picture gives an overview of the recent updates:
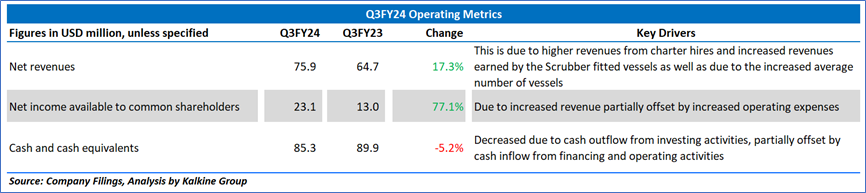
2.2 Insights of Q3FY24:
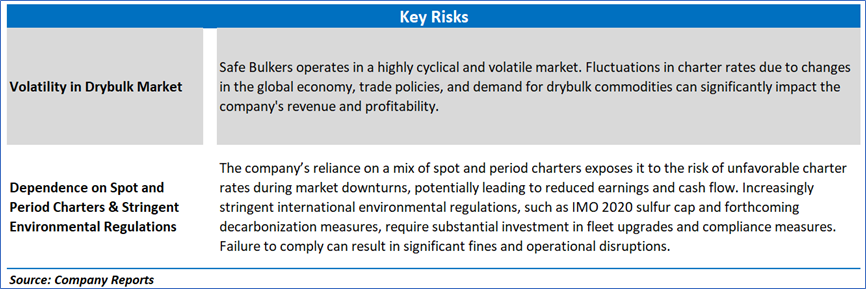
Section 3: Key Risks and Outlook:
Section 4: Stock Recommendation Summary:
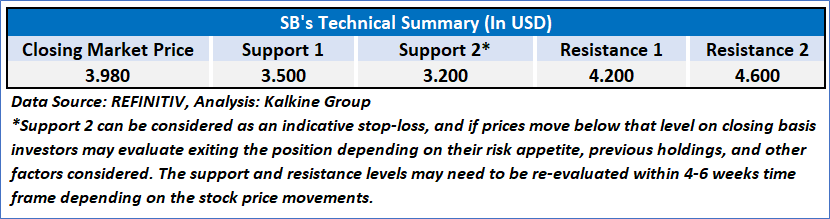
4.1 Technical Summary:
Price Performance:
- SB's share price has corrected by 21.96% in the past three months. Similarly, in the long term, the stock has corrected by 27.23% over the past six months.
- The stock is leaning towards the lower band of its 52-week range of USD 6.33 and 52-week low price of USD 3.45, with the current price broken near an important support area of USD 3.50-USD 3.80, therefore an expectation of upward movement if the levels sustain.
- The price is currently below both its short-term (50-day) SMA and long-term (200-day) SMA, with the current RSI of 32.60, downward trending nearing oversold zone, with expectations of upward movement.
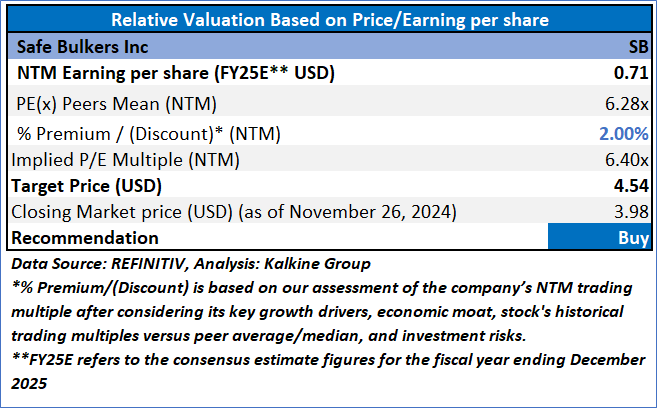
4.2 Fundamental Valuation
Valuation Methodology: Price/Earnings Per Share Multiple Based Relative Valuation
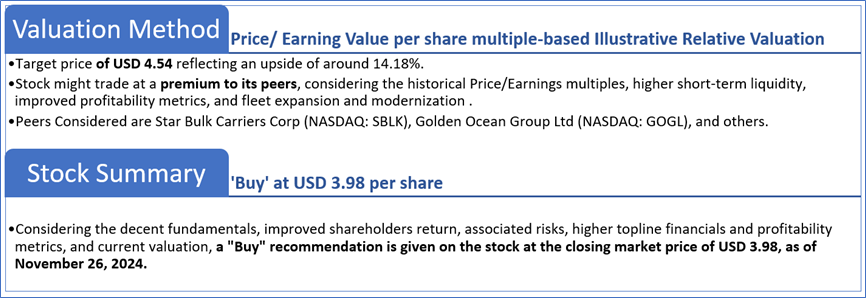
Markets are trading in a highly volatile zone currently due to certain macroeconomic issues and geopolitical tensions prevailing. Therefore, it is prudent to follow a cautious approach while investing.
Note 1: Past performance is not a reliable indicator of future performance.
Note 2: The reference date for all price data, currency, technical indicators, support, and resistance levels is November 26, 2024. The reference data in this report has been partly sourced from REFINITIV.
Note 3: Investment decisions should be made depending on an individual's appetite for upside potential, risks, holding duration, and any previous holdings. An 'Exit' from the stock can be considered if the Target Price mentioned as per the Valuation and or the technical levels provided has been achieved and is subject to the factors discussed above.
Note 4: The report publishing date is as per the Pacific Time Zone.
Technical Indicators Defined: -
Support: A level at which the stock prices tend to find support if they are falling, and a downtrend may take a pause backed by demand or buying interest. Support 1 refers to the nearby support level for the stock and if the price breaches the level, then Support 2 may act as the crucial support level for the stock.
Resistance: A level at which the stock prices tend to find resistance when they are rising, and an uptrend may take a pause due to profit booking or selling interest. Resistance 1 refers to the nearby resistance level for the stock and if the price surpasses the level, then Resistance 2 may act as the crucial resistance level for the stock.
Stop-loss: It is a level to protect against further losses in case of unfavorable movement in the stock prices.
Disclaimer-
This report has been issued by Kalkine Pty Limited (ABN 34 154 808 312) (Australian financial services licence number 425376) (“Kalkine”) and prepared by Kalkine and its related bodies corporate authorised to provide general financial product advice. Kalkine.com.au and associated pages are published by Kalkine.
Any advice provided in this report is general advice only and does not take into account your objectives, financial situation or needs. You should therefore consider whether the advice is appropriate to your objectives, financial situation and needs before acting upon it.
There may be a Product Disclosure Statement, Information Statement or other offer document for the securities or other financial products referred to in Kalkine reports. You should obtain a copy of the relevant Product Disclosure Statement, Information Statement or offer document and consider the statement or document before making any decision about whether to acquire the security or product.
Choosing an investment is an important decision. If you do not feel confident making a decision based on the recommendations Kalkine has made in our reports, you should consider seeking advice from a financial adviser, stockbroker or other professional (including taxation and legal advice) before acting on any advice in this report or on the Kalkine website. Not all investments are appropriate for all people.
The information in this report and on the Kalkine website has been prepared from a wide variety of sources, which Kalkine, to the best of its knowledge and belief, considers accurate. Kalkine has made every effort to ensure the reliability of information contained in its reports, newsletters and websites. All information represents our views at the date of publication and may change without notice. The information in this report does not constitute an offer to sell securities or other financial products or a solicitation of an offer to buy securities or other financial products. Our reports contain general recommendations to invest in securities and other financial products.
Kalkine is not responsible for, and does not guarantee, the performance of the investments mentioned in this report This report may contain information on past performance of particular investments. Past performance is not an indicator of future performance. Hypothetical returns may not reflect actual performance. Any displays of potential investment opportunities are for sample purposes only and may not actually be available to investors. To the extent permitted by law, Kalkine excludes all liability for any loss or damage arising from the use of this report, the Kalkine website and any information published on the Kalkine website (including any indirect or consequential loss, any data loss or data corruption). If the law prohibits this exclusion, Kalkine hereby limits its liability, to the extent permitted by law, to the resupply of services..
Please also read our Terms & Conditions and Financial Services Guide for further information. Employees and/or associates of Kalkine and its related entities may hold interests in the securities or other financial products covered in this report or on the Kalkine website. Any such employees and associates are required to comply with certain safeguards, procedures and disclosures as required by law.
Kalkine Media Pty Ltd, an affiliate of Kalkine Pty Ltd, may have received, or be entitled to receive, financial consideration in connection with providing information about certain entity(s) covered on its website including entities covered in this Report.
Past performance is not a reliable indicator of future performance.
 AU
AU
 Please wait processing your request...