Section 1: Company Overview and Fundamentals
1.1 Company Overview:
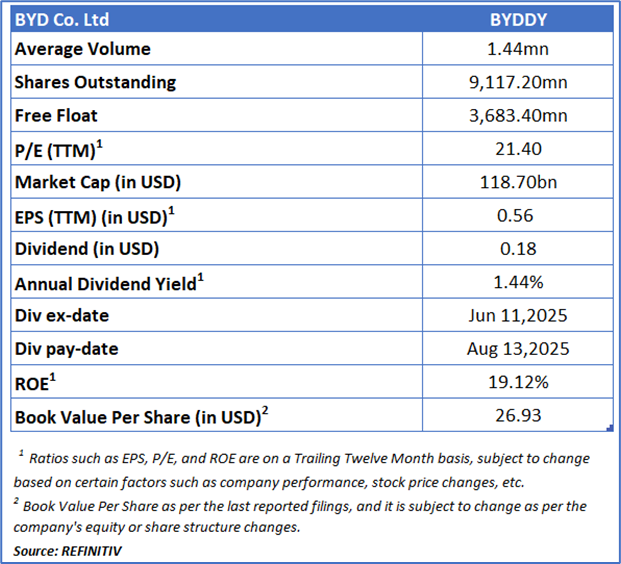
BYD Co. Ltd (OTC: BYDDY) is a China-based manufacturing company primarily engaged in transportation equipment, with a core focus on new energy vehicles (NEVs). Its operations also span mobile phone components and assembly, secondary rechargeable batteries, and photovoltaic products. The company markets passenger vehicles under the “Dynasty” and “Ocean” series and operates across both domestic and international markets.
Kalkine’s Dividend Income Report covers the Company Overview, Key positives & negatives, Investment summary, Key investment metrics, Top 10 shareholding, Business updates and insights into company recent financial results, Key Risks & Outlook, Price performance and technical summary, Target Price, and Recommendation on the stock.
Price Performance:
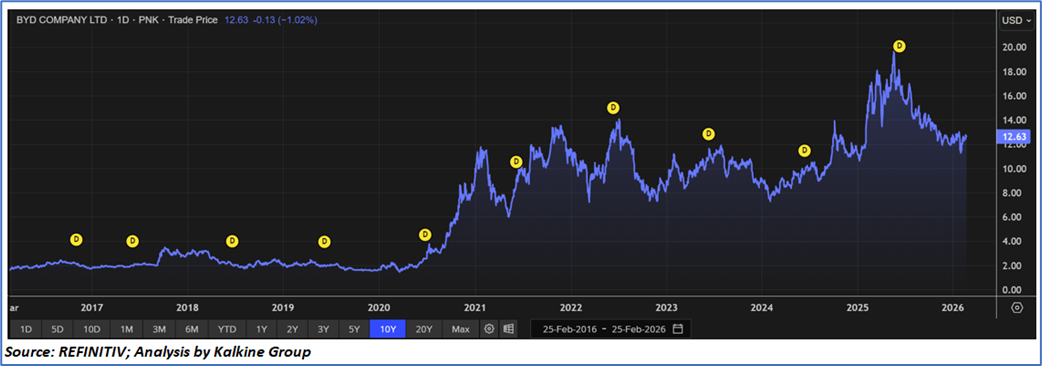
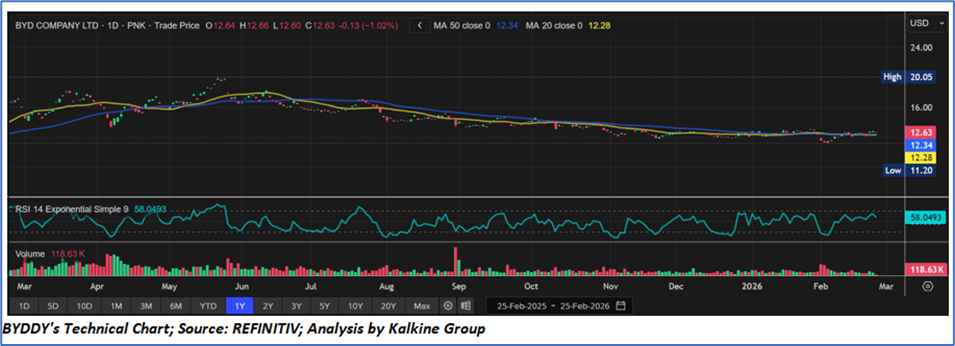
- The stock is trading at USD 12.63, hovering around the 20-day and 50-day moving averages, indicating short-term consolidation rather than a strong directional move.
- The broader trend remains corrective after the prior peak near USD 20, with price action forming a potential base around the USD 11.2–12.0 support zone.
- The RSI (~58) reflects neutral-to-moderately positive momentum, suggesting improving strength but not overbought conditions.
- Trading volumes remain relatively muted, indicating limited strong accumulation and confirming the current range-bound structure.
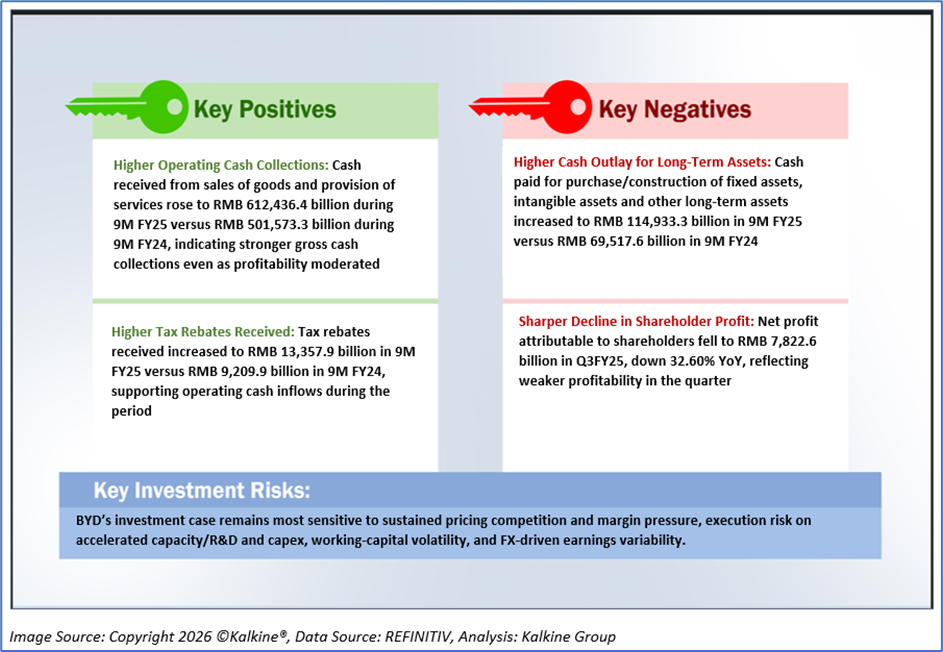
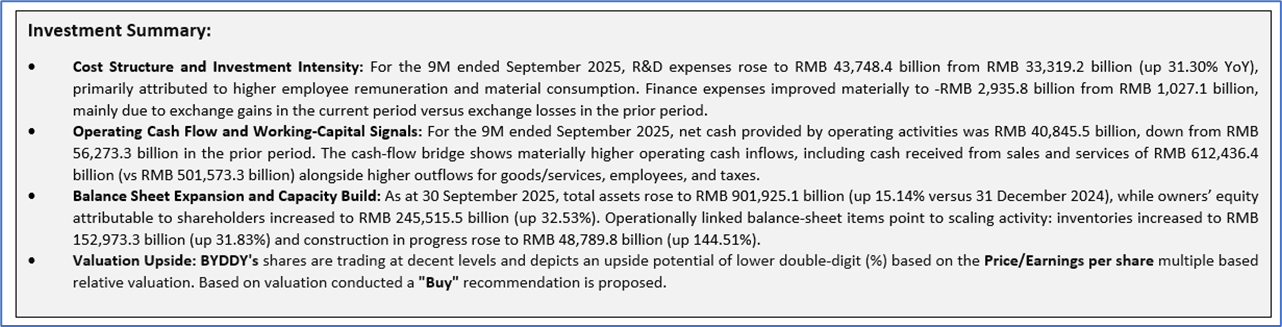
1.2 The Key Positives, Negatives, and Investment summary
1.3 Stable Yet Modest Dividend Profile Reflecting Growth Orientation:
BYD’s dividend yield history underscores its positioning as a growth-focused enterprise with a conservative and disciplined payout approach. The yield has generally remained at modest levels, reflecting management’s priority toward reinvestment in expansion, technology, and capacity rather than aggressive cash distribution. Variations in dividend yield appear largely driven by share price movements—compressing during periods of strong stock appreciation and expanding during price corrections—rather than significant shifts in dividend policy. Overall, the company maintains a stable and consistent distribution pattern, with dividends serving as a complementary component of shareholder returns rather than the primary investment proposition.
1.4 Key Metrics
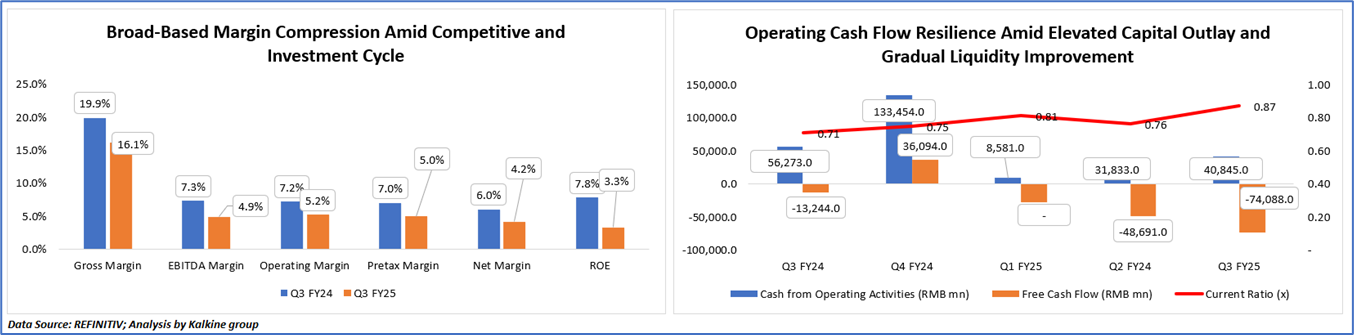
Broad-Based Margin Compression Amid Competitive and Investment Cycle
The decline across gross margin, EBITDA margin, operating margin, pretax margin, net margin, and ROE in Q3FY25 compared to Q3FY24 reflects a combination of competitive pricing pressure in the NEV segment and elevated cost intensity linked to expansion initiatives. Increased R&D spending, higher employee and material costs, and scaling-related overheads likely compressed operating leverage, while a growing equity base diluted return ratios. Additionally, working capital build-up and capacity investments may have weighed on short-term efficiency, indicating that the moderation in profitability aligns with an investment-driven growth phase rather than structural weakness.
Operating Cash Flow Resilience Amid Elevated Capital Outlay and Gradual Liquidity Improvement
On the liquidity standpoint, the chart reflects relatively stable operating cash flow generation across quarters, with Q3FY25 showing recovery versus earlier fluctuations, indicating that core operations continue to generate meaningful cash despite earnings moderation. However, free cash flow remains negative and has widened in Q3FY25, primarily due to significantly higher capital expenditure associated with capacity expansion, technology upgrades, and vertical integration initiatives. Increased investment in construction in progress and production scaling likely absorbed a substantial portion of operating inflows. Meanwhile, the gradual improvement in the current ratio—from 0.71 to 0.87—suggests strengthening short-term liquidity, supported by higher cash balances and working-capital management. Overall, the divergence between stable operating cash flow and negative free cash flow signals an investment-heavy phase rather than operational weakness, with liquidity gradually improving despite aggressive capital deployment.
Section 2: Business Updates and Financial Highlights
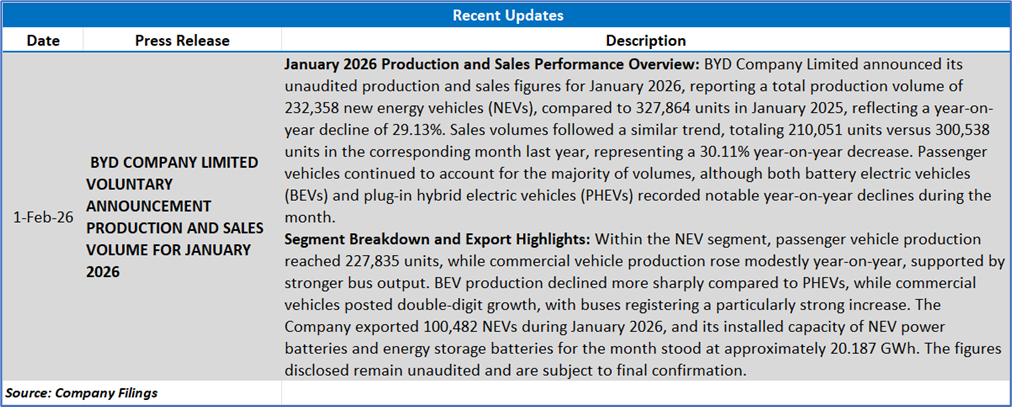
2.1 Recent Updates:
The below picture gives an overview of the recent updates:
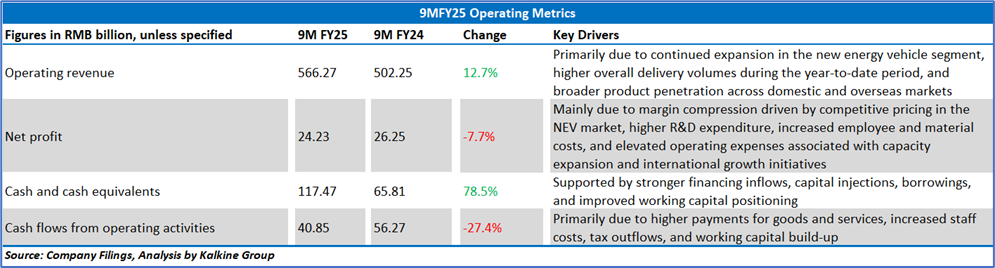
2.2 Insights of 9M FY25:
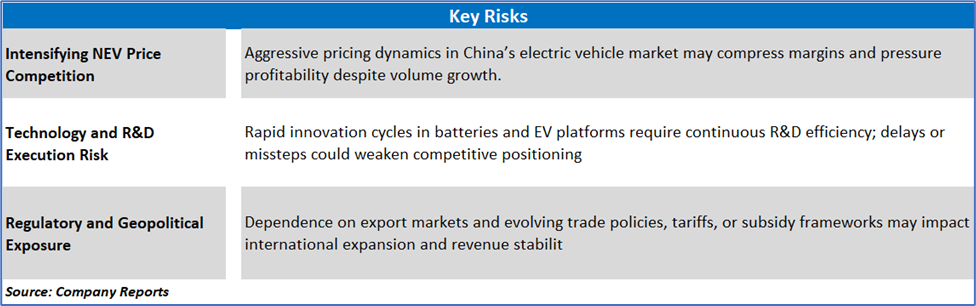
Section 3: Key Risks and Outlook:
Section 4: Stock Recommendation Summary:
4.1 Technical Summary:
Price Performance:
- The stock is trading at USD 12.63, hovering around the 20-day and 50-day moving averages, indicating short-term consolidation rather than a strong directional move.
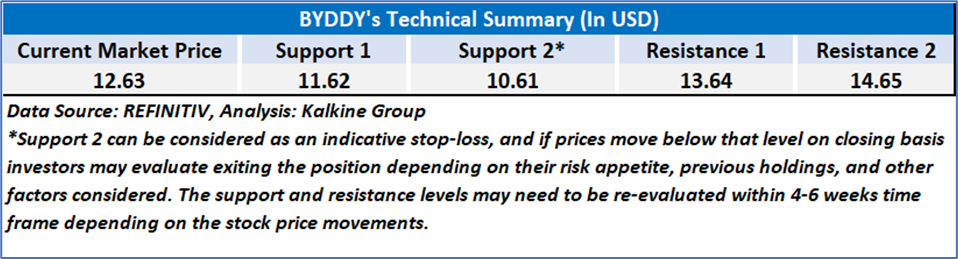
- The broader trend remains corrective after the prior peak near USD 20, with price action forming a potential base around the USD 11.2–12.0 support zone.
- The RSI (~58) reflects neutral-to-moderately positive momentum, suggesting improving strength but not overbought conditions.
- Trading volumes remain relatively muted, indicating limited strong accumulation and confirming the current range-bound structure.
4.2 Fundamental Valuation
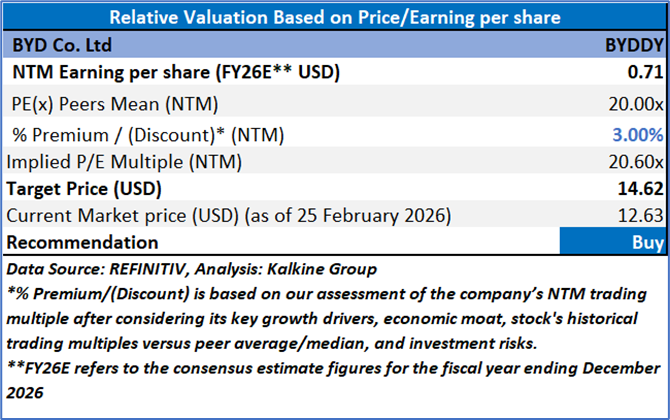
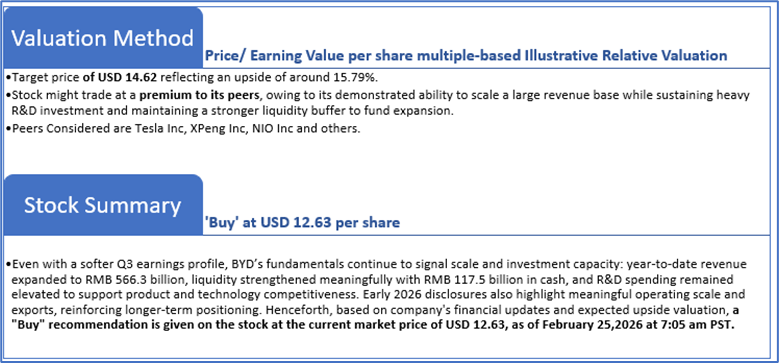
Valuation Methodology: Price/Earnings Multiple Based Relative Valuation
Markets are trading in a highly volatile zone currently due to certain macroeconomic issues and geopolitical tensions prevailing. Therefore, it is prudent to follow a cautious approach while investing.
Note 1: Past performance is not a reliable indicator of future performance.
Note 2: The reference date for all price data, currency, technical indicators, support, and resistance levels is February 25, 2026. The reference data in this report has been partly sourced from REFINITIV.
Note 3: Investment decisions should be made depending on an individual's appetite for upside potential, risks, holding duration, and any previous holdings. An 'Exit' from the stock can be considered if the Target Price mentioned as per the Valuation and or the technical levels provided has been achieved and is subject to the factors discussed above.
Note 4: The report publishing date is as per the Pacific Time Zone.
Technical Indicators Defined: -
Support: A level at which the stock prices tend to find support if they are falling, and a downtrend may take a pause backed by demand or buying interest. Support 1 refers to the nearby support level for the stock and if the price breaches the level, then Support 2 may act as the crucial support level for the stock.
Resistance: A level at which the stock prices tend to find resistance when they are rising, and an uptrend may take a pause due to profit booking or selling interest. Resistance 1 refers to the nearby resistance level for the stock and if the price surpasses the level, then Resistance 2 may act as the crucial resistance level for the stock.
Stop-loss: It is a level to protect against further losses in case of unfavorable movement in the stock prices.
Disclaimer-
This report (“Report”) has been issued by Kalkine Pty Limited (ABN 34 154 808 312) (Australian financial services licence number 425376) (“Kalkine”) and prepared by Kalkine and its related bodies corporate who are authorised to provide general financial product advice. Kalkine.com.au and its associated pages are published by Kalkine.
Any advice provided in this Report is general advice only and does not take into account your objectives, financial situation or needs. You should therefore consider whether the advice is appropriate for your objectives, financial situation and needs before acting upon it.
There may be a Product Disclosure Statement, Information Memorandum or other offer document (“Offer Document”) for the securities or other financial products referred in this Report. You should obtain a copy of the relevant Offer Document and consider it before making any decision about whether to acquire the security or financial product.
Kalkine strongly recommends that you seek advice from a financial adviser, stockbroker or other professional (including taxation and legal advice) before acting on any of the general advice in this Report or on the Kalkine website. Not all investments are appropriate for all people.
The information in this Report and on the Kalkine website has been prepared from a wide variety of sources, which Kalkine, to the best of its knowledge and belief, considers accurate. Kalkine has made every effort to ensure the reliability of the information contained in its reports (including this Report), newsletters and websites. All information represents our views at the date of publication and may change without notice.
The information in this Report does not constitute an offer to sell securities or other financial products or a solicitation of an offer to buy securities or other financial products. Our reports contain general recommendations to invest in securities and other financial products. Kalkine is not responsible for, and does not guarantee, the performance of, or returns on, any investments mentioned in this Report.
Kalkine does not issue, sell or deal in any financial products.
This Report may contain information on past performance of particular investments. Past performance is not a reliable indicator of future performance. Returns stated do not take into account transaction costs and taxes. To the extent permitted by law, and excluding any dishonesty or gross negligence by Kalkine, Kalkine disclaims and excludes all liability for any direct, indirect, implied, punitive, special, incidental or other consequential loss or damage arising from the use of or reliance on this Report, the Kalkine website and any information published on the Kalkine website without any warranties or representations by Kalkine to you. To the extent the law prohibits or limits this exclusion, Kalkine limits its liability to the resupply of services.
Please also read our Terms & Conditions and Financial Services Guide for further information. Employees and/or associates of Kalkine and its related entities may hold interests in the securities or other financial products covered in this Report or on the Kalkine website. Any such employees and associates are required to comply with certain, procedures and disclosures as required by law.
Kalkine Media Pty Ltd, an affiliate of Kalkine Pty Ltd, may have received, or be entitled to receive, financial consideration in connection with providing information about certain entity(s) covered on its website including entities covered in this Report.
Copyright 2026 Krish Capital Pty. Ltd. (ABN 61629651510). All Rights Reserved. No part of this report, or its content, may be reproduced in any form without our prior consent.
Past performance is not a reliable indicator of future performance.

 CA
 NZ
 UK
 US
 IND

 AU

 Please wait processing your request...