
Section 1: Company Overview and Fundamentals
1.1 Company Overview:
JD. Com Inc (NASDAQ: JD) is a company principally engaged in the e-commerce business, including online retail and online marketplace mainly through its retail mobile apps and www.jd.com website (collectively, JD Platform). The Company operates its businesses through four segments. JD Retail segment, including JD Health, JD Industrials, and other components, mainly engage in online retail, online marketplace and marketing services in China.
Kalkine’s Dividend Income Report covers the Company Overview, Key positives & negatives, Investment summary, Key investment metrics, Top 10 shareholding, Business updates and insights into company recent financial results, Key Risks & Outlook, Price performance and technical summary, Target Price, and Recommendation on the stock.
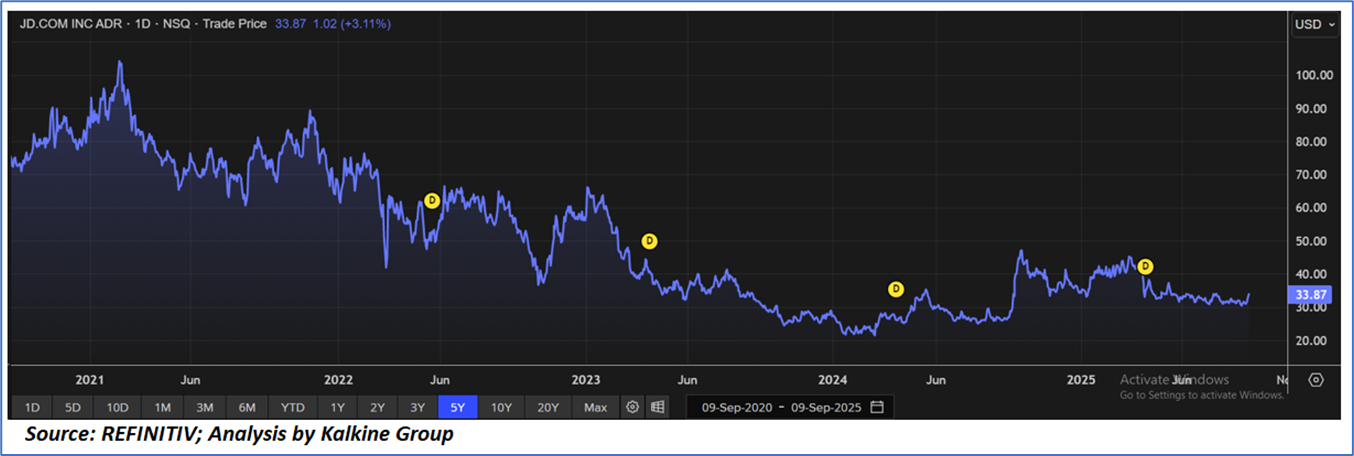
Price Performance:
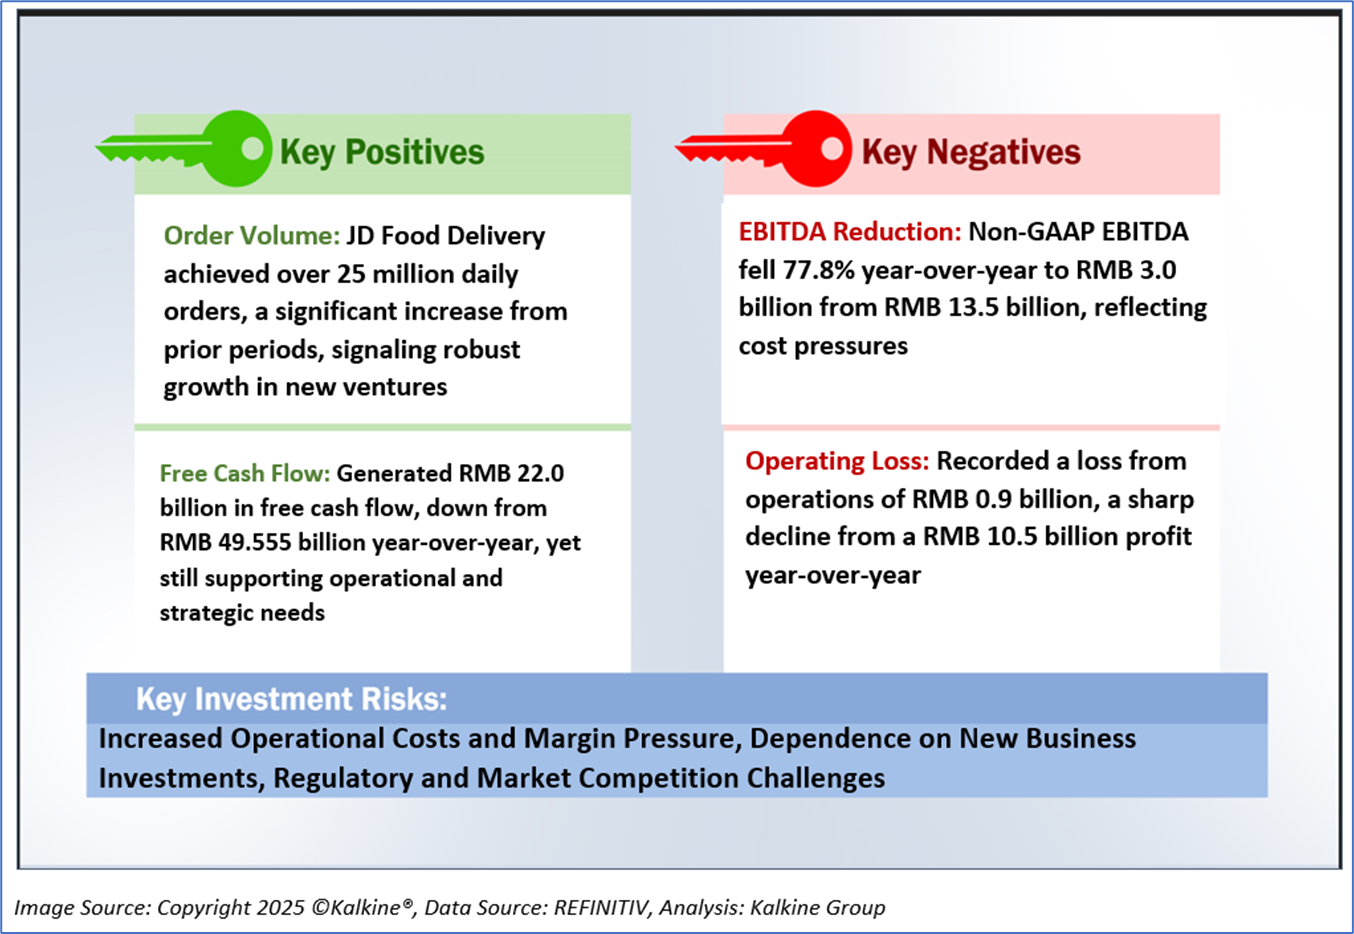
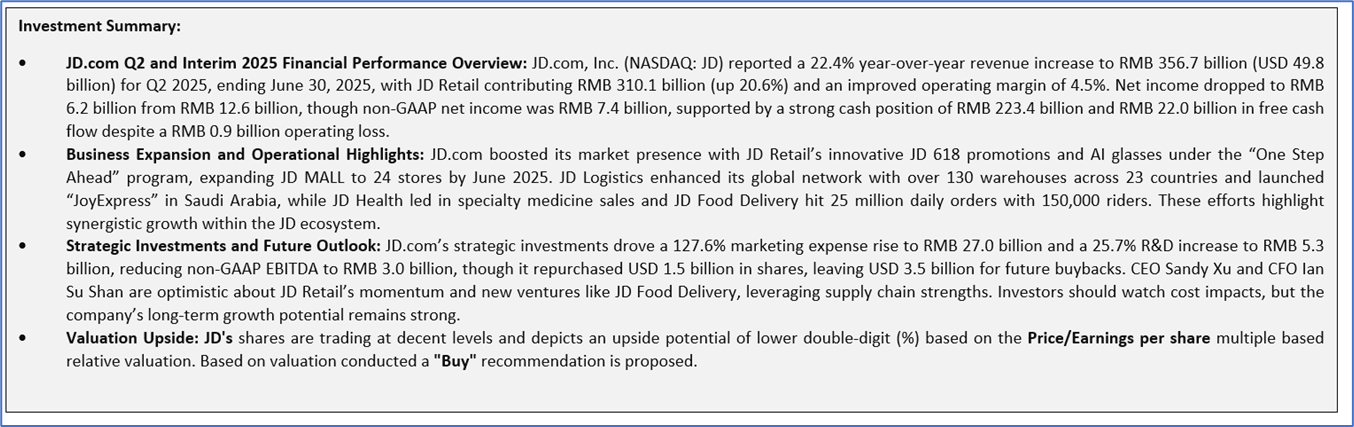
1.2 The Key Positives, Negatives, and Investment summary
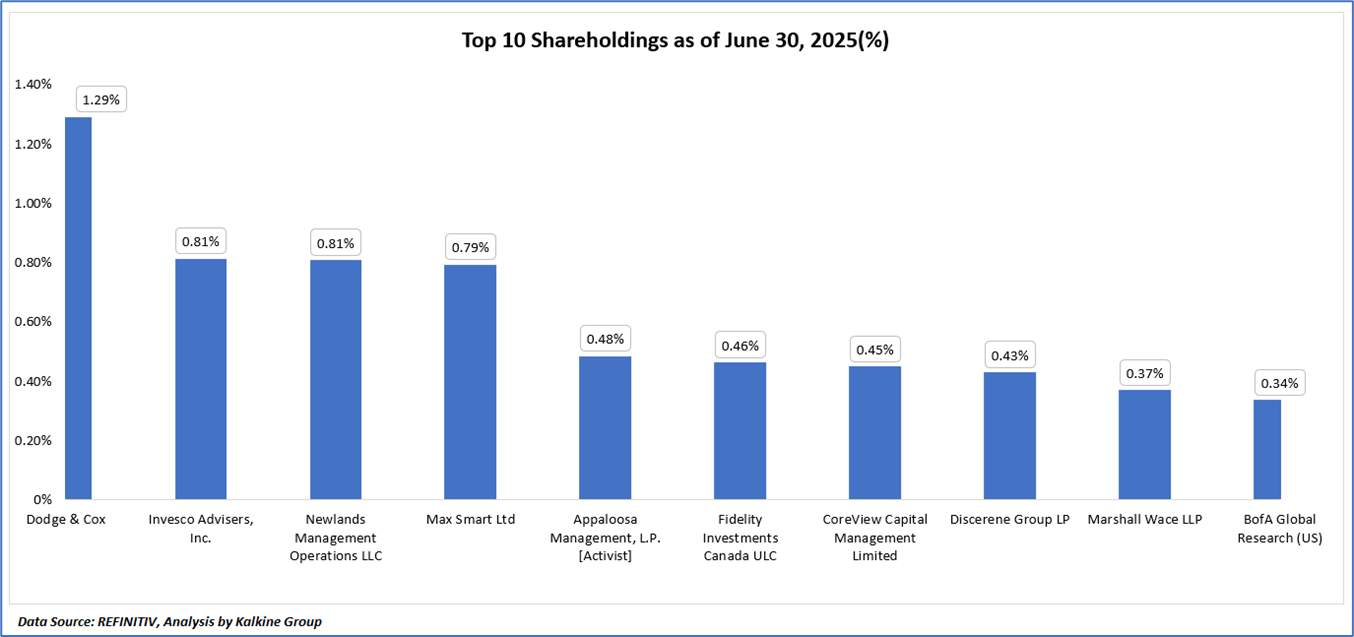
1.3 Top 10 shareholders:
The top 10 shareholders together form ~6.23% of the total shareholding, signifying diverse shareholding. Dodge & Cox, and Invesco Advisers, Inc. are the biggest shareholders, holding the maximum stake in the company at ~1.29% and ~0.81%, respectively.
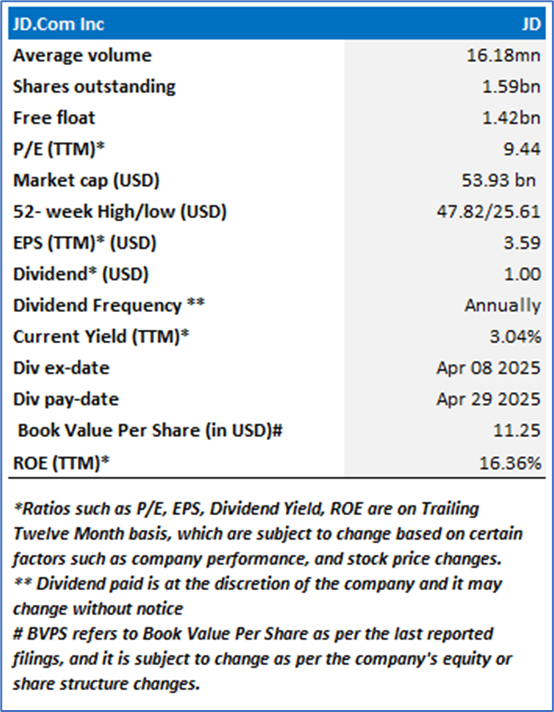
1.4 Dividend payments with impressive dividend yield:
JD.com, Inc. (NASDAQ: JD), a leading supply chain-based technology provider, has maintained a shareholder-friendly dividend policy since initiating regular quarterly payouts in 2021, with the most recent declaration on August 14, 2025, following its Q2 2025 results, reflecting a commitment to returning value amid robust financials, including a 22.4% year-over-year revenue increase to RMB 356.7 billion and a solid cash position of RMB 223.4 billion as of June 30, 2025. The company’s dividends, typically in the range of USD 0.20 to USD 0.50 per ADS quarterly, are funded by distributable profits and supported by its strong free cash flow of RMB 22.0 billion in Q2, though the policy remains at the Board’s discretion, influenced by operational needs and market conditions as of September 10, 2025. Historical trends from the stock price chart (2021-2025) reveal consistent "D" markers indicating dividend ex-dates, often correlating with price stability or modest gains around payment periods, such as post-2021 launches where shares rose from USD 70 to over USD 100 amid initial payouts, though recent volatility from 2024-2025 shows dips to USD 33.87 despite dividends, suggesting dividends provide downside support but are insufficient against broader market pressures like trade tensions and economic slowdowns, with year-over-year share repurchases of USD 1.5 billion further enhancing total returns.
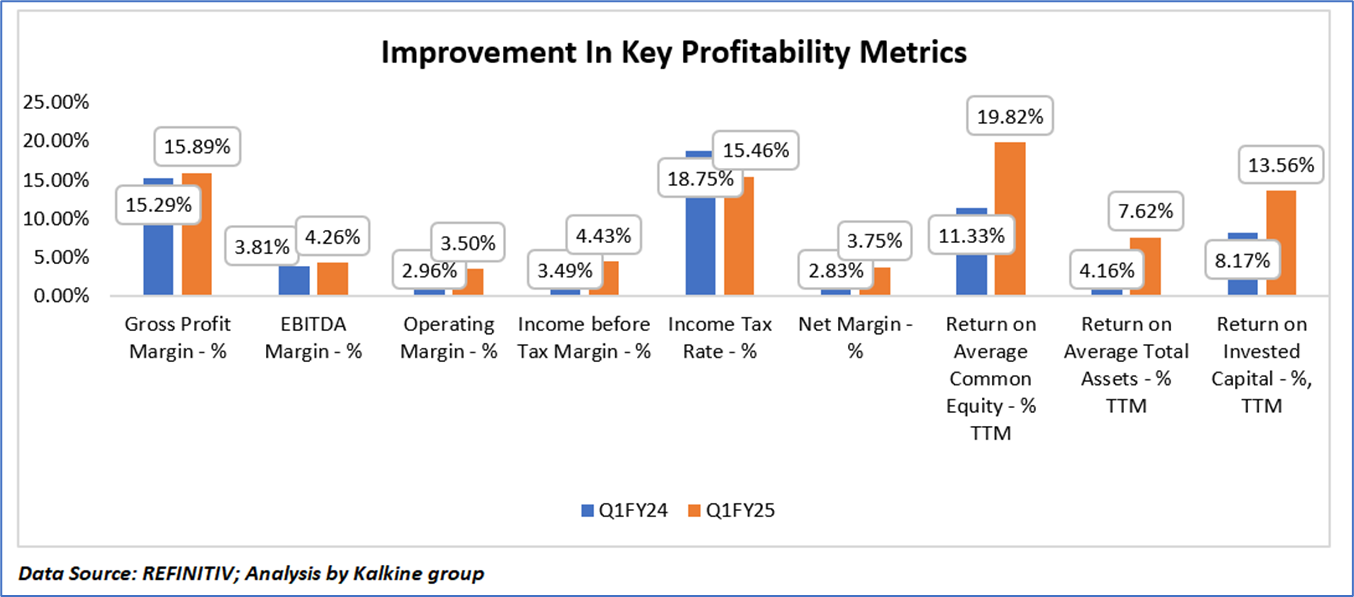
1.5 Key Metrics
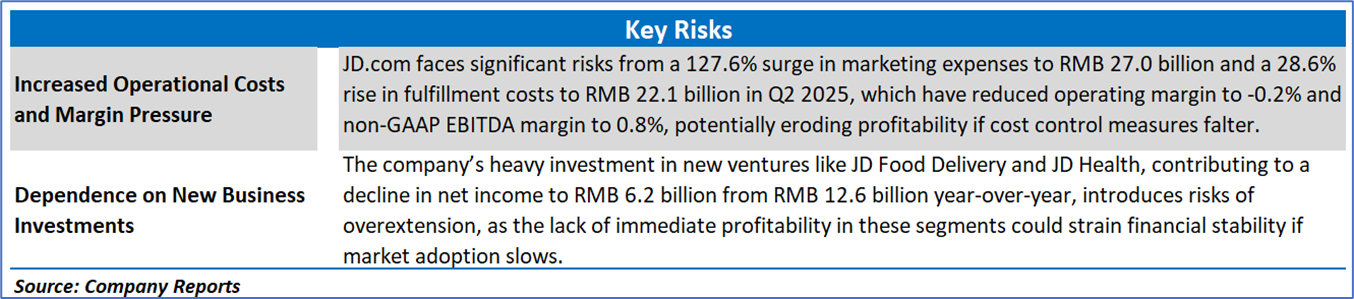
JD.com, Inc. (NASDAQ: JD), a leading supply chain-based technology and service provider, demonstrated a steady improvement in its financial metrics for the first quarter of fiscal 2025 compared to the same period in 2024, with gross profit margin rising from 15.29% to 15.89%, reflecting enhanced cost management and a 22.4% year-over-year revenue increase to RMB 356.7 billion, and analyzed as of 05:07 PM IST on Wednesday, September 10, 2025. Profitability metrics showed positive trends, with EBITDA margin increasing from 3.81% to 4.26%, operating margin advancing from 2.96% to 3.50%, and income before tax margin improving from 3.49% to 4.43%, supported by a reduced income tax rate from 18.75% to 15.46%, contributing to a net margin rise from 2.83% to 3.75%, while return on average common equity surged from 11.33% to 19.82%, return on average total assets climbed from 4.16% to 7.62%, and return on invested capital grew from 8.17% to 13.56%, indicating robust capital efficiency and operational strength. This analysis suggests that despite increased investments in marketing (up 127.6% to RMB 27.0 billion) and fulfillment, JD.com’s focus on supply chain optimization and retail growth has bolstered profitability and return metrics, positioning it for sustained value creation, though investors should remain vigilant about the impact of rising costs on future margins.
Section 2: Business Updates and Financial Highlights
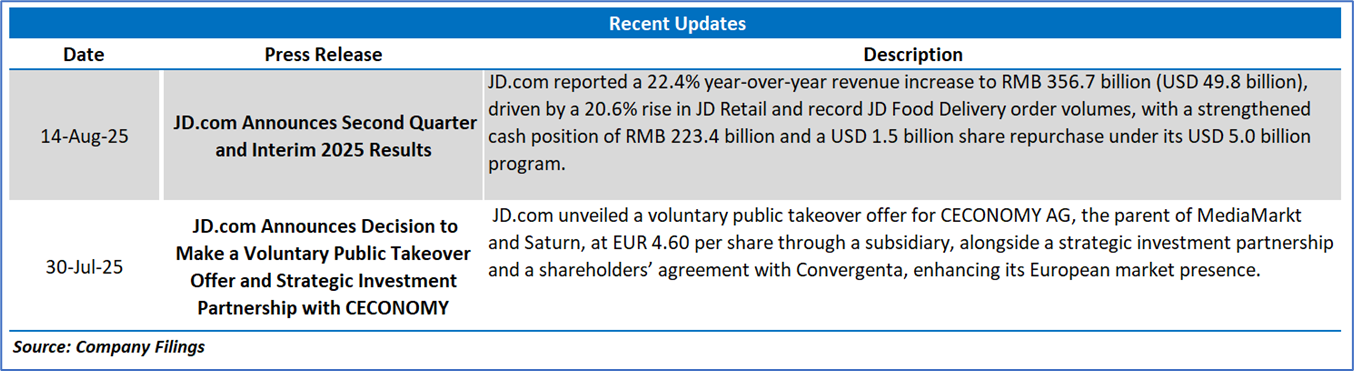
2.1 Recent Updates:
The below picture gives an overview of the recent updates:
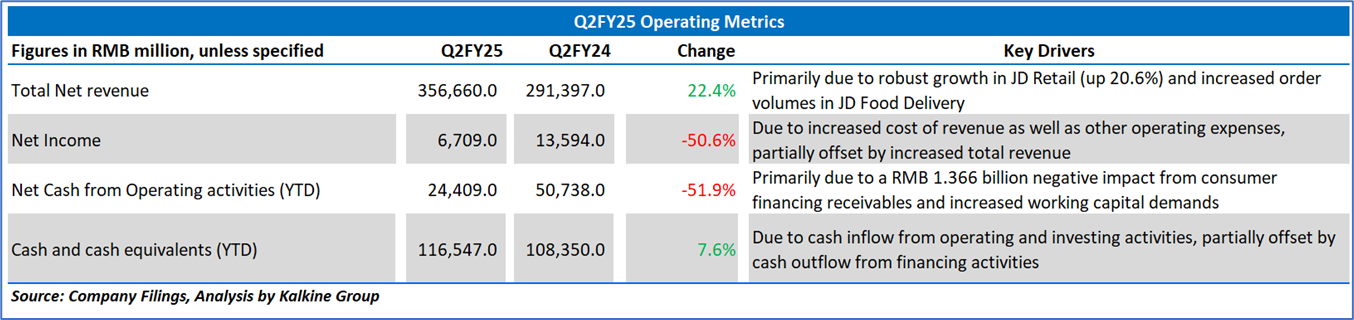
2.2 Insights of Q2FY25:
Section 3: Key Risks and Outlook for FY2025:
Section 4: Stock Recommendation Summary:
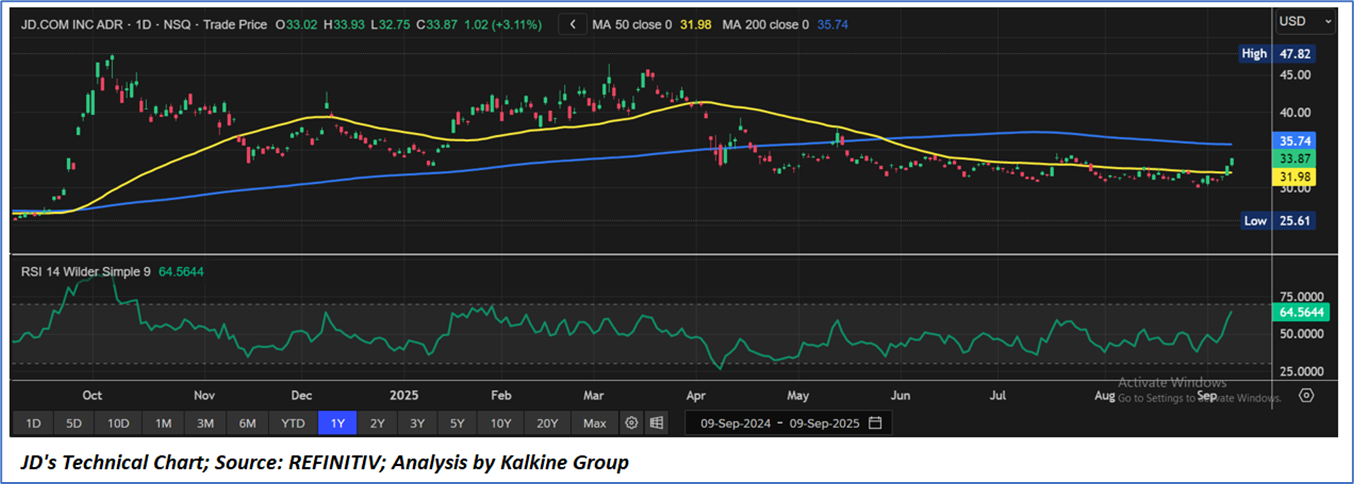
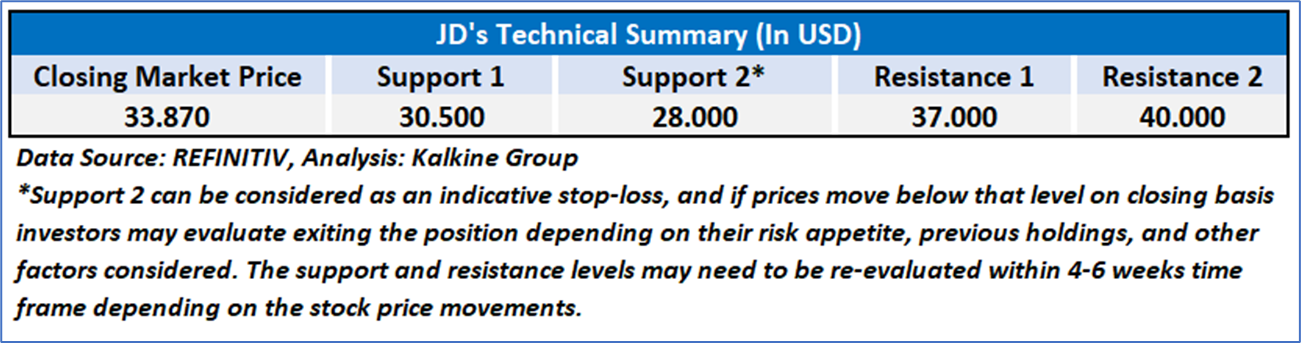
4.1 Technical Summary:
Price Performance:
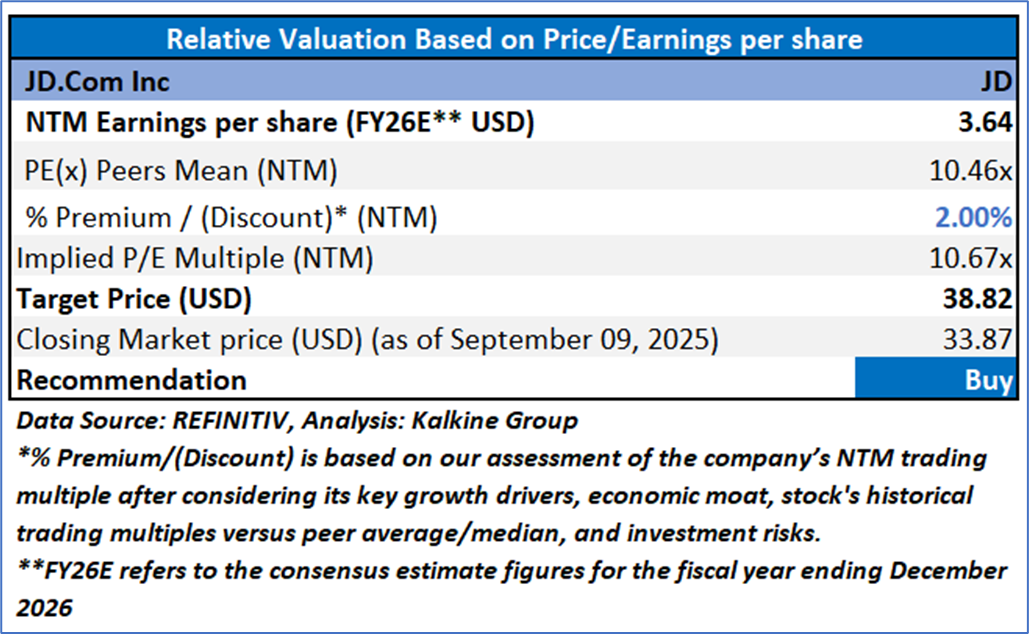
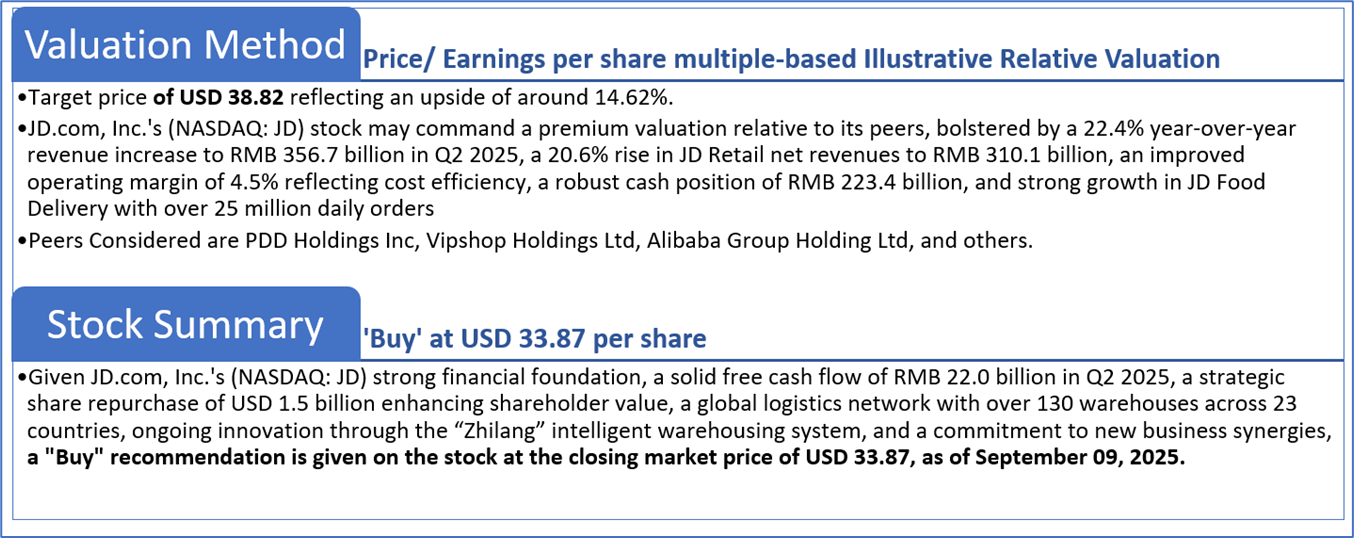
4.2 Fundamental Valuation
Valuation Methodology: Price/Earnings Per Share Multiple Based Relative Valuation
Markets are trading in a highly volatile zone currently due to certain macroeconomic issues and geopolitical tensions prevailing. Therefore, it is prudent to follow a cautious approach while investing.
Note 1: Past performance is not a reliable indicator of future performance.
Note 2: The reference date for all price data, currency, technical indicators, support, and resistance levels is September 09, 2025. The reference data in this report has been partly sourced from REFINITIV.
Note 3: Investment decisions should be made depending on an individual's appetite for upside potential, risks, holding duration, and any previous holdings. An 'Exit' from the stock can be considered if the Target Price mentioned as per the Valuation and or the technical levels provided has been achieved and is subject to the factors discussed above.
Note 4: The report publishing date is as per the Pacific Time Zone.
Technical Indicators Defined: -
Support: A level at which the stock prices tend to find support if they are falling, and a downtrend may take a pause backed by demand or buying interest. Support 1 refers to the nearby support level for the stock and if the price breaches the level, then Support 2 may act as the crucial support level for the stock.
Resistance: A level at which the stock prices tend to find resistance when they are rising, and an uptrend may take a pause due to profit booking or selling interest. Resistance 1 refers to the nearby resistance level for the stock and if the price surpasses the level, then Resistance 2 may act as the crucial resistance level for the stock.
Stop-loss: It is a level to protect against further losses in case of unfavorable movement in the stock prices.
This report (“Report”) has been issued by Kalkine Pty Limited (ABN 34 154 808 312) (Australian financial services licence number 425376) (“Kalkine”) and prepared by Kalkine and its related bodies corporate who are authorised to provide general financial product advice. Kalkine.com.au and its associated pages are published by Kalkine.
Any advice provided in this Report is general advice only and does not take into account your objectives, financial situation or needs. You should therefore consider whether the advice is appropriate for your objectives, financial situation and needs before acting upon it.
There may be a Product Disclosure Statement, Information Memorandum or other offer document (“Offer Document”) for the securities or other financial products referred in this Report. You should obtain a copy of the relevant Offer Document and consider it before making any decision about whether to acquire the security or financial product.
Kalkine strongly recommends that you seek advice from a financial adviser, stockbroker or other professional (including taxation and legal advice) before acting on any of the general advice in this Report or on the Kalkine website. Not all investments are appropriate for all people.
The information in this Report and on the Kalkine website has been prepared from a wide variety of sources, which Kalkine, to the best of its knowledge and belief, considers accurate. Kalkine has made every effort to ensure the reliability of the information contained in its reports (including this Report), newsletters and websites. All information represents our views at the date of publication and may change without notice.
The information in this Report does not constitute an offer to sell securities or other financial products or a solicitation of an offer to buy securities or other financial products. Our reports contain general recommendations to invest in securities and other financial products. Kalkine is not responsible for, and does not guarantee, the performance of, or returns on, any investments mentioned in this Report.
Kalkine does not issue, sell or deal in any financial products.
This Report may contain information on past performance of particular investments. Past performance is not a reliable indicator of future performance. Returns stated do not take into account transaction costs and taxes. To the extent permitted by law, and excluding any dishonesty or gross negligence by Kalkine, Kalkine disclaims and excludes all liability for any direct, indirect, implied, punitive, special, incidental or other consequential loss or damage arising from the use of or reliance on this Report, the Kalkine website and any information published on the Kalkine website without any warranties or representations by Kalkine to you. To the extent the law prohibits or limits this exclusion, Kalkine limits its liability to the resupply of services.
Please also read our Terms & Conditions and Financial Services Guide for further information. Employees and/or associates of Kalkine and its related entities may hold interests in the securities or other financial products covered in this Report or on the Kalkine website. Any such employees and associates are required to comply with certain, procedures and disclosures as required by law.
Kalkine Media Pty Ltd, an affiliate of Kalkine Pty Ltd, may have received, or be entitled to receive, financial consideration in connection with providing information about certain entity(s) covered on its website including entities covered in this Report.
Copyright 2025 Krish Capital Pty. Ltd. (ABN 61629651510). All Rights Reserved. No part of this report, or its content, may be reproduced in any form without our prior consent.
Past performance is not a reliable indicator of future performance.
 Please wait processing your request...