Kalkine has a fully transformed New Avatar.
Section 1: Company Overview and Fundamentals
1.1 Company Overview:
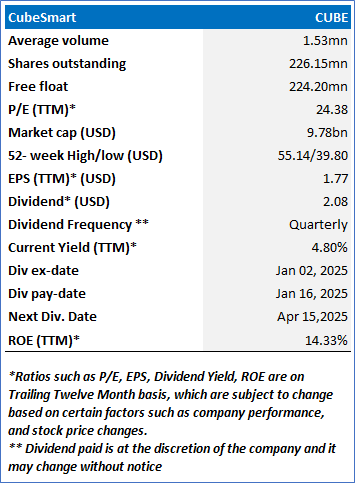
CubeSmart (NYSE: CUBE) is a self-administered and self-managed real estate investment trust. The Company's self-storage properties are designed to offer climate-controlled storage space for residential and commercial customers. It owns its assets and conducts its operations through the CubeSmart, L.P. (Operating Partnership), and subsidiaries of the Operating Partnership. Its customers rent storage cubes for their exclusive use, on a month-to-month basis.
Kalkine’s Dividend Income Report covers the Company Overview, Key positives & negatives, Investment summary, Key investment metrics, Top 10 shareholding, Business updates and insights into company recent financial results, Key Risks & Outlook, Price performance and technical summary, Target Price, and Recommendation on the stock.
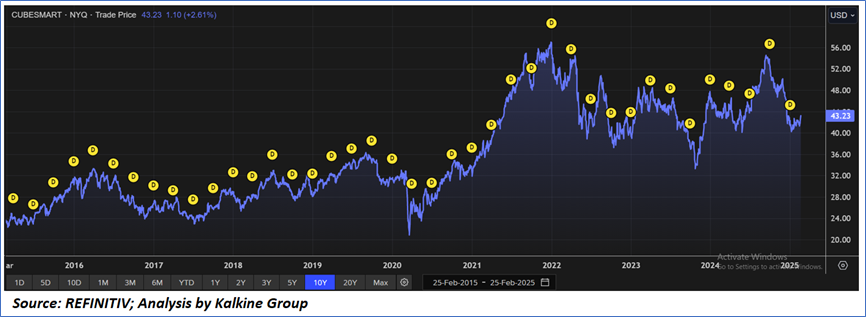
Price Performance:
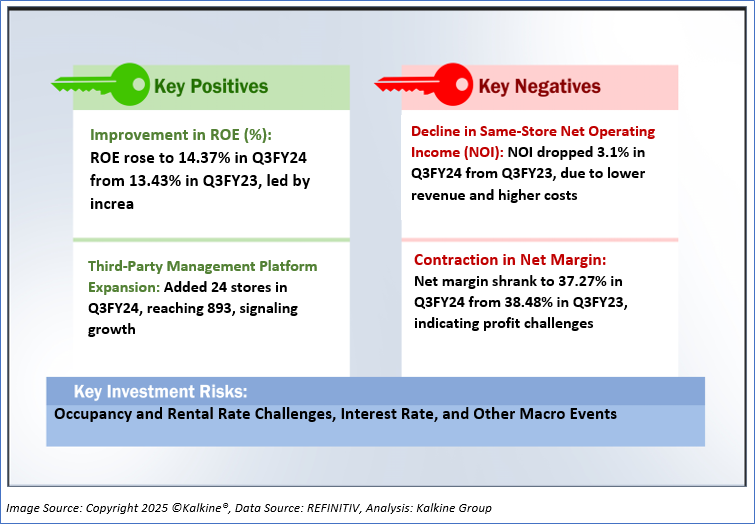
1.2 The Key Positives, Negatives, and Investment summary

1.3 Top 10 shareholders:
The top 10 shareholders together form ~48.66% of the total shareholding, signifying concentrated shareholding. The Vanguard Group, Inc., and BlackRock Institutional Trust Company, N.A. are the biggest shareholders, holding the maximum stake in the company at ~13.84% and ~10.56%, respectively.

1.4 Dividend payments with impressive dividend yield:
CubeSmart (CUBE), a real estate investment trust (REIT) specializing in self-storage facilities, has established a robust dividend history since it began paying dividends in 2004. As a REIT, CubeSmart is required to distribute at least 90% of its taxable income to shareholders, which has supported its consistent dividend payments over the past 19 years. The company has demonstrated a commitment to dividend growth, increasing its payout five times in the last five years, with an average annual growth rate of approximately 9.52% over the past decade. As of February 26, 2025, CubeSmart offers an annual dividend of USD 2.08 per share, paid quarterly, with the most recent payment of USD0.52 per share on January 16, 2025, following an ex-dividend date of January 2, 2025. This translates to a current yield of around 5%, which is competitive within the REIT sector, though slightly below the broader real estate sector average of 5.99%. Despite a payout ratio of 114%, indicating that it pays out more than its earnings, CubeSmart’s steady cash flow from its self-storage operations has sustained its dividend, making it an attractive option for income-focused investment.
1.5 Key Metrics
CubeSmart (CUBE) has shown steady financial growth in recent years, as reflected in its operating income and total revenue from 2019 to 2023. Total revenue increased significantly from USD643.92 million in 2019 to USD1,050.33 million in 2023, demonstrating robust expansion, particularly with a notable jump to USD1,009.62 million in 2022. Operating income also rose, starting at USD232.07 million in 2019 and reaching USD497.28 million in 2023, despite a dip to USD290.6 million in 2021. This growth indicates strong operational performance, likely driven by the company's focus on self-storage facilities and its ability to generate consistent cash flow. However, the 2021 dip in operating income suggests potential challenges, such as increased costs or economic pressures, though recovery in subsequent years highlights resilience.

Section 2: Business Updates and Financial Highlights
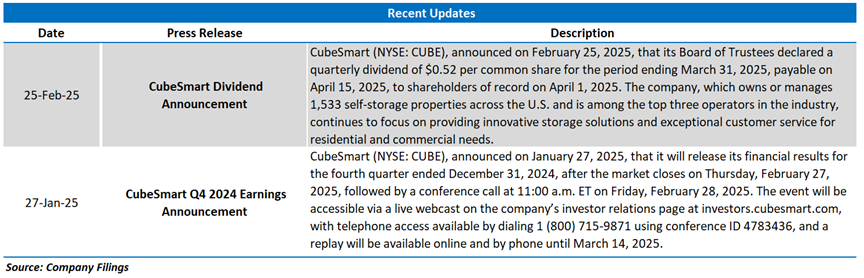
2.1 Recent Updates:
The below picture gives an overview of the recent updates:
2.2 Insights of Q3FY24:

Section 3: Key Risks and Outlook:


Section 4: Stock Recommendation Summary:
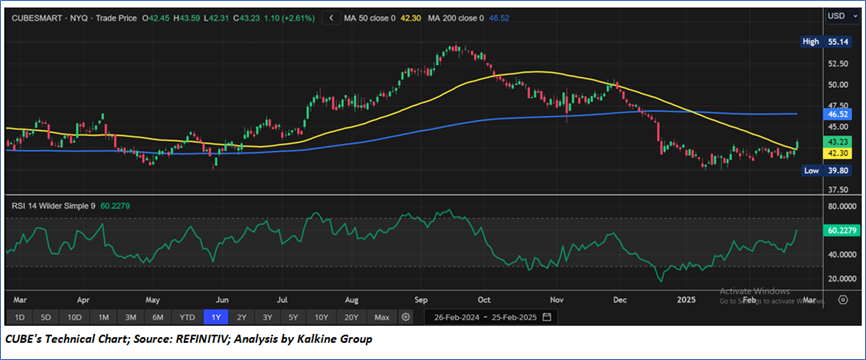
4.1 Technical Summary:
Price Performance:

4.2 Fundamental Valuation
Valuation Methodology: Price/Earnings Per Share Multiple Based Relative Valuation


Markets are trading in a highly volatile zone currently due to certain macroeconomic issues and geopolitical tensions prevailing. Therefore, it is prudent to follow a cautious approach while investing.
Note 1: Past performance is not a reliable indicator of future performance.
Note 2: The reference date for all price data, currency, technical indicators, support, and resistance levels is February 25, 2025. The reference data in this report has been partly sourced from REFINITIV.
Note 3: Investment decisions should be made depending on an individual's appetite for upside potential, risks, holding duration, and any previous holdings. An 'Exit' from the stock can be considered if the Target Price mentioned as per the Valuation and or the technical levels provided has been achieved and is subject to the factors discussed above.
Note 4: The report publishing date is as per the Pacific Time Zone.
Technical Indicators Defined: -
Support: A level at which the stock prices tend to find support if they are falling, and a downtrend may take a pause backed by demand or buying interest. Support 1 refers to the nearby support level for the stock and if the price breaches the level, then Support 2 may act as the crucial support level for the stock.
Resistance: A level at which the stock prices tend to find resistance when they are rising, and an uptrend may take a pause due to profit booking or selling interest. Resistance 1 refers to the nearby resistance level for the stock and if the price surpasses the level, then Resistance 2 may act as the crucial resistance level for the stock.
Stop-loss: It is a level to protect against further losses in case of unfavorable movement in the stock prices.
This report has been issued by Kalkine Pty Limited (ABN 34 154 808 312) (Australian financial services licence number 425376) (“Kalkine”) and prepared by Kalkine and its related bodies corporate authorised to provide general financial product advice. Kalkine.com.au and associated pages are published by Kalkine.
Any advice provided in this report is general advice only and does not take into account your objectives, financial situation or needs. You should therefore consider whether the advice is appropriate to your objectives, financial situation and needs before acting upon it.
There may be a Product Disclosure Statement, Information Statement or other offer document for the securities or other financial products referred to in Kalkine reports. You should obtain a copy of the relevant Product Disclosure Statement, Information Statement or offer document and consider the statement or document before making any decision about whether to acquire the security or product.
Choosing an investment is an important decision. If you do not feel confident making a decision based on the recommendations Kalkine has made in our reports, you should consider seeking advice from a financial adviser, stockbroker or other professional (including taxation and legal advice) before acting on any advice in this report or on the Kalkine website. Not all investments are appropriate for all people.
The information in this report and on the Kalkine website has been prepared from a wide variety of sources, which Kalkine, to the best of its knowledge and belief, considers accurate. Kalkine has made every effort to ensure the reliability of information contained in its reports, newsletters and websites. All information represents our views at the date of publication and may change without notice. The information in this report does not constitute an offer to sell securities or other financial products or a solicitation of an offer to buy securities or other financial products. Our reports contain general recommendations to invest in securities and other financial products.
Kalkine is not responsible for, and does not guarantee, the performance of the investments mentioned in this report This report may contain information on past performance of particular investments. Past performance is not an indicator of future performance. Hypothetical returns may not reflect actual performance. Any displays of potential investment opportunities are for sample purposes only and may not actually be available to investors. To the extent permitted by law, Kalkine excludes all liability for any loss or damage arising from the use of this report, the Kalkine website and any information published on the Kalkine website (including any indirect or consequential loss, any data loss or data corruption). If the law prohibits this exclusion, Kalkine hereby limits its liability, to the extent permitted by law, to the resupply of services..
Please also read our Terms & Conditions and Financial Services Guide for further information. Employees and/or associates of Kalkine and its related entities may hold interests in the securities or other financial products covered in this report or on the Kalkine website. Any such employees and associates are required to comply with certain safeguards, procedures and disclosures as required by law.
Kalkine Media Pty Ltd, an affiliate of Kalkine Pty Ltd, may have received, or be entitled to receive, financial consideration in connection with providing information about certain entity(s) covered on its website including entities covered in this Report.
Past performance is not a reliable indicator of future performance.
 Please wait processing your request...