Section 1: Company Overview and Fundamentals
1.1 Company Overview:
Barrick Gold Corporation (NYSE: GOLD) is a Canada-based gold and copper producer. The Company is principally engaged in the production and sale of gold and copper, as well as related activities, such as exploration and mine development. The Company has ownership interests in producing gold mines that are in Argentina, Canada, Cote d'Ivoire, the Democratic Republic of the Congo, the Dominican Republic, Mali, Tanzania and the United States.
Kalkine’s Dividend Income Report covers the Company Overview, Key positives & negatives, Investment summary, Key investment metrics, Top 10 shareholding, Business updates and insights into company recent financial results, Key Risks & Outlook, Price performance and technical summary, Target Price, and Recommendation on the stock.
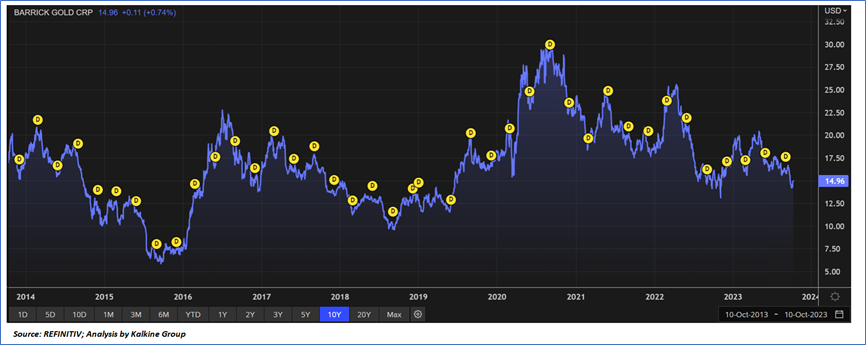
Stock Performance:
1.2 The Key Positives, Negatives, and Investment summary
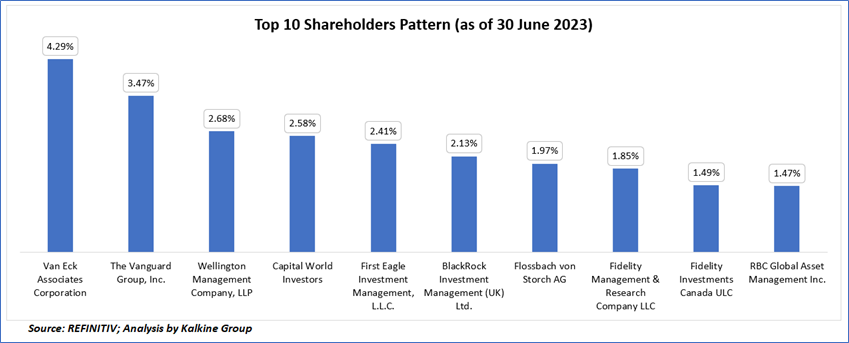
1.3 Top 10 shareholders:
The top 10 shareholders together form ~24.33% of the total shareholding, signifying diverse shareholding. Van Eck Associates Corporation, and The Vanguard Group, Inc., are the biggest shareholders, holding the maximum stake in the company at ~4.29% and ~3.47%, respectively.
1.4 Consistent dividend payments with impressive dividend yield:
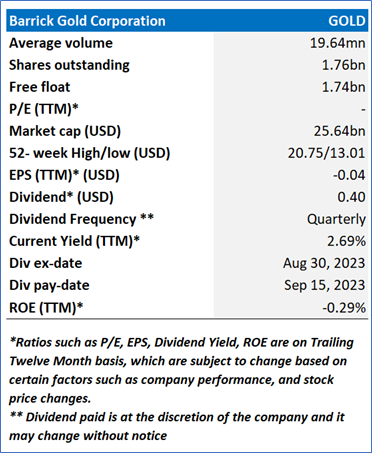
Barrick has officially declared a dividend of USD0.10 per share for the second quarter of 2023, aligning with the Performance Dividend Policy introduced at the beginning of 2022. Shareholders who are recorded as such by the end of business on August 31, 2023, will receive the Q2 2023 dividend on September 15, 2023.
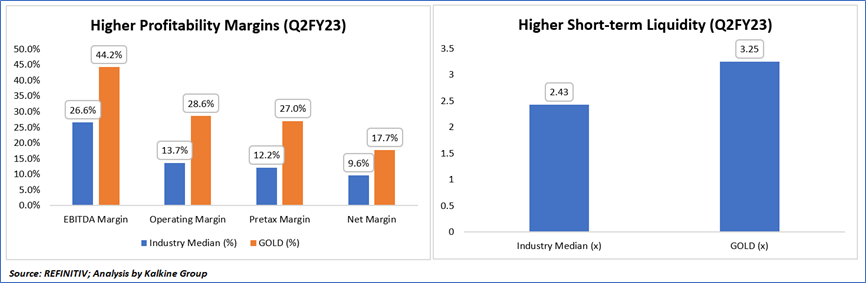
1.5 Key Metrics
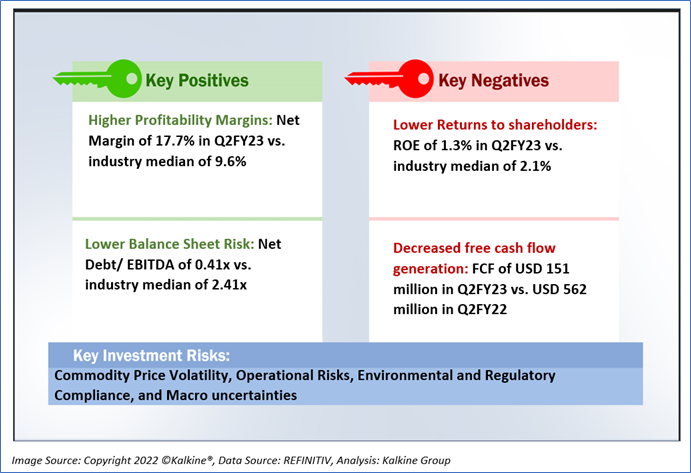
In comparison to industry medians, Barrick Gold (GOLD) demonstrates stronger financial performance as highlighted by various key metrics. For instance, the current ratio for GOLD stands at 3.25, surpassing the industry median of 2.43, indicating better short-term liquidity and ability to cover current liabilities. Furthermore, GOLD exhibits robust profitability with higher EBITDA Margin (44.2% compared to the industry median of 26.6%), Operating Margin (28.6% compared to 13.7%), Pretax Margin (27.0% compared to 12.2%), and Net Margin (17.7% compared to 9.6%), illustrating its strong operational efficiency and profitability in the industry.
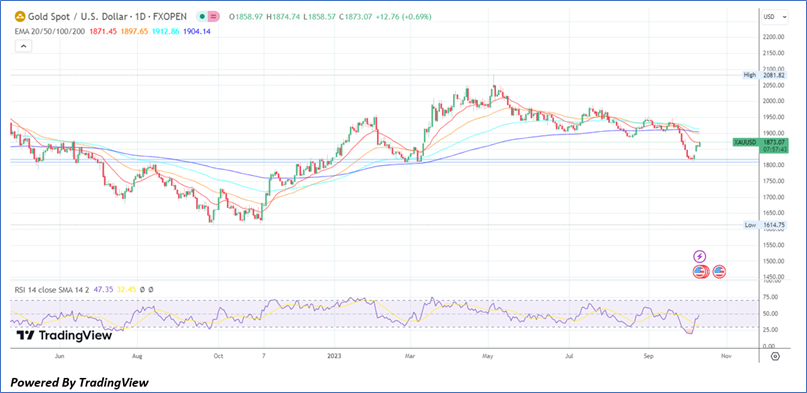
1.6 Underlying Commodities Analysis:
Gold remained steady at approximately USD1,860 per ounce, marking a 1.5% increase for the week, primarily attributed to dovish signals from the US Federal Reserve. These signals, which have weakened the dollar and Treasury yields, have also boosted gold prices. Notably, Atlanta Fed President Raphael Bostic stated that the central bank may not need to raise interest rates further to address inflation concerns, a sentiment echoed by Minneapolis Fed President Neel Kashkari. Market expectations currently favor the Fed maintaining steady interest rates at the upcoming November policy meeting. Moreover, gold experienced a notable 1.6% surge on Monday due to heightened geopolitical risks in the Middle East stemming from the Israel-Hamas conflict, further intensifying safe-haven demand for the precious metal.
Section 2: Business Updates and Financial Highlights
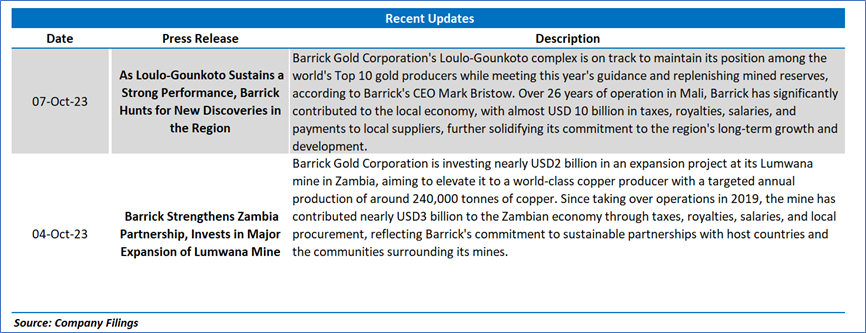
2.1 Recent Updates:
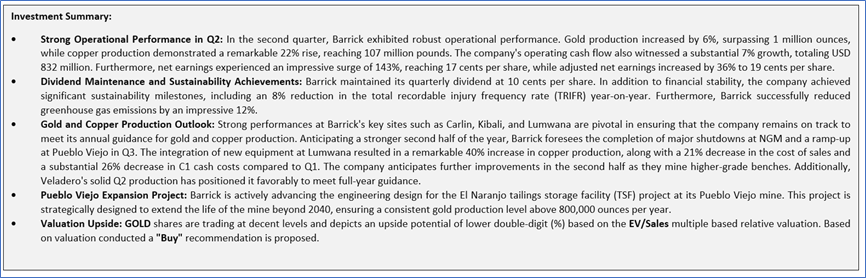
The below picture gives an overview of the recent updates:
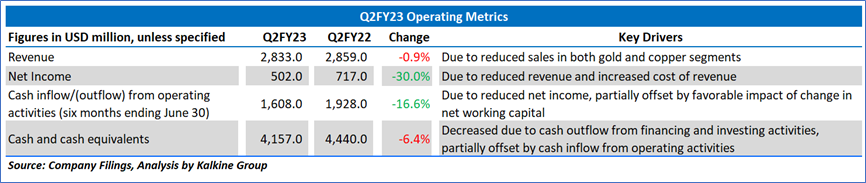
2.2 Insights of Q2FY23:
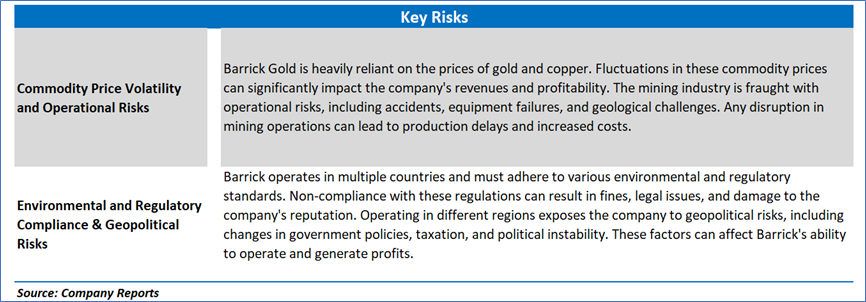
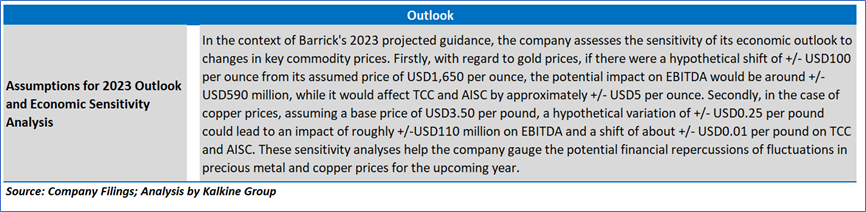
Section 3: Key Risks and Outlook:
Section 4: Stock Recommendation Summary:
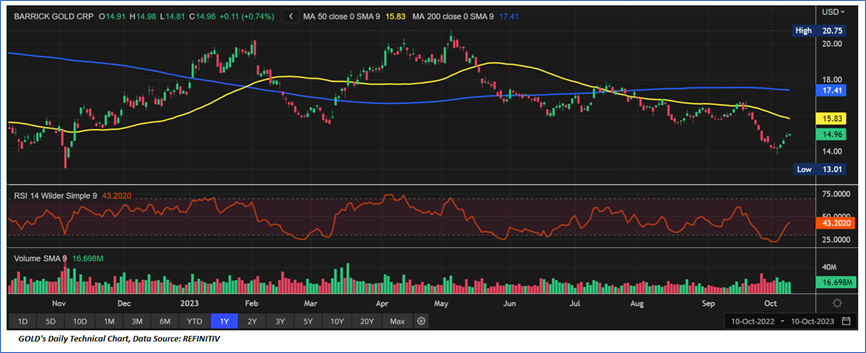
4.1 Price Performance and Technical Summary:
Stock Performance:
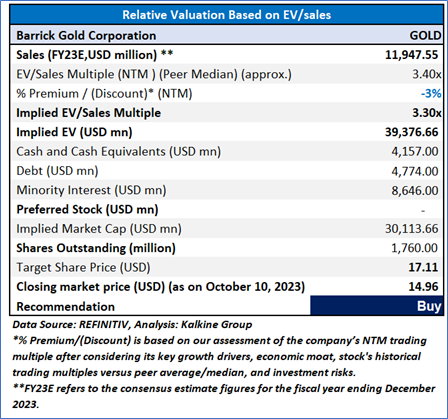
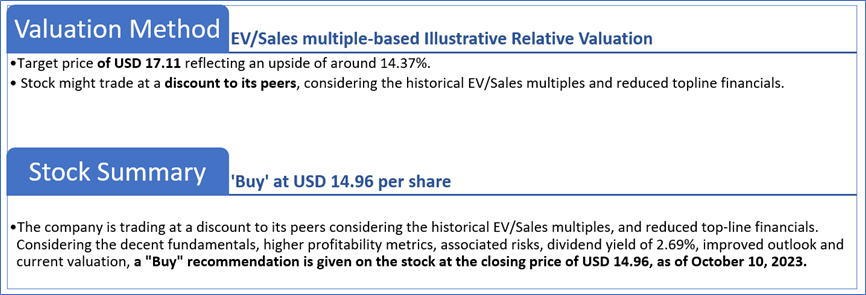
4.2 Fundamental Valuation
Valuation Methodology: EV/Sales Multiple Based Relative Valuation
Markets are trading in a highly volatile zone currently due to certain macroeconomic issues and geopolitical tensions prevailing. Therefore, it is prudent to follow a cautious approach while investing.
Note 1: Past performance is not a reliable indicator of future performance.
Note 2: The reference date for all price data, currency, technical indicators, support, and resistance levels is October 10, 2023. The reference data in this report has been partly sourced from REFINITIV.
Note 3: Investment decisions should be made depending on an individual's appetite for upside potential, risks, holding duration, and any previous holdings. An 'Exit' from the stock can be considered if the Target Price mentioned as per the Valuation and or the technical levels provided has been achieved and is subject to the factors discussed above.
Note 4: The report publishing date is as per the Pacific Time Zone.
Technical Indicators Defined: -
Support: A level at which the stock prices tend to find support if they are falling, and a downtrend may take a pause backed by demand or buying interest. Support 1 refers to the nearby support level for the stock and if the price breaches the level, then Support 2 may act as the crucial support level for the stock.
Resistance: A level at which the stock prices tend to find resistance when they are rising, and an uptrend may take a pause due to profit booking or selling interest. Resistance 1 refers to the nearby resistance level for the stock and if the price surpasses the level, then Resistance 2 may act as the crucial resistance level for the stock.
Stop-loss: It is a level to protect against further losses in case of unfavorable movement in the stock prices.
Disclaimer - This report has been issued by Kalkine Pty Limited (ABN 34 154 808 312) (Australian financial services licence number 425376) (“Kalkine”) and prepared by Kalkine and its related bodies corporate authorised to provide general financial product advice. Kalkine.com.au and associated pages are published by Kalkine.
Any advice provided in this report is general advice only and does not take into account your objectives, financial situation or needs. You should therefore consider whether the advice is appropriate to your objectives, financial situation and needs before acting upon it.
There may be a Product Disclosure Statement, Information Statement or other offer document for the securities or other financial products referred to in Kalkine reports. You should obtain a copy of the relevant Product Disclosure Statement, Information Statement or offer document and consider the statement or document before making any decision about whether to acquire the security or product.
You should also seek advice from a financial adviser, stockbroker or other professional (including taxation and legal advice) as necessary before acting on any advice in this report or on the Kalkine website. Not all investments are appropriate for all people.
The information in this report and on the Kalkine website has been prepared from a wide variety of sources, which Kalkine, to the best of its knowledge and belief, considers accurate. Kalkine has made every effort to ensure the reliability of information contained in its reports, newsletters and websites. All information represents our views at the date of publication and may change without notice.
Kalkine does not guarantee the performance of, or returns on, any investment. To the extent permitted by law, Kalkine excludes all liability for any loss or damage arising from the use of this report, the Kalkine website and any information published on the Kalkine website (including any indirect or consequential loss, any data loss or data corruption). If the law prohibits this exclusion, Kalkine hereby limits its liability, to the extent permitted by law, to the resupply of services. Please note past performance is neither an indicator nor a guarantee of future performance.
Please also read our Terms & Conditions and Financial Services Guide for further information.
Employees and/or associates of Kalkine and its related entities may hold interests in the securities or other financial products covered in this report or on the Kalkine website. Any such employees and associates are required to comply with certain safeguards, procedures and disclosures as required by law.
Kalkine Media Pty Ltd, an affiliate of Kalkine Pty Ltd, may have received, or be entitled to receive, financial consideration in connection with providing information about certain entity(s) covered on its website including entities covered in this Report.
Past performance is not a reliable indicator of future performance.
 Please wait processing your request...