
Key Highlights
- The Energy sector ($XEJ) is the primary market leader, accelerating as oil prices breach $US100/bbl.
- Investors are rotating into Financials ($XFJ) and Staples ($XSJ) to capture higher bank margins and defensive stability.
- Momentum in Resources ($XJR) and Materials ($XMJ) is fading due to production downgrades and China-related shipping bans.
- Information Technology ($XIJ) remains the worst-performing sector as 10-year bond yields hit 4.96%.
Last week, the Australian market experienced a violent rotation in capital, driven by surging bond yields and a geopolitical energy shock. While the broader index faced significant pressure, a clear divergence emerged between sectors benefiting from inflation and those punished by rising interest rates.
ASX Sector Weekly Momentum chart
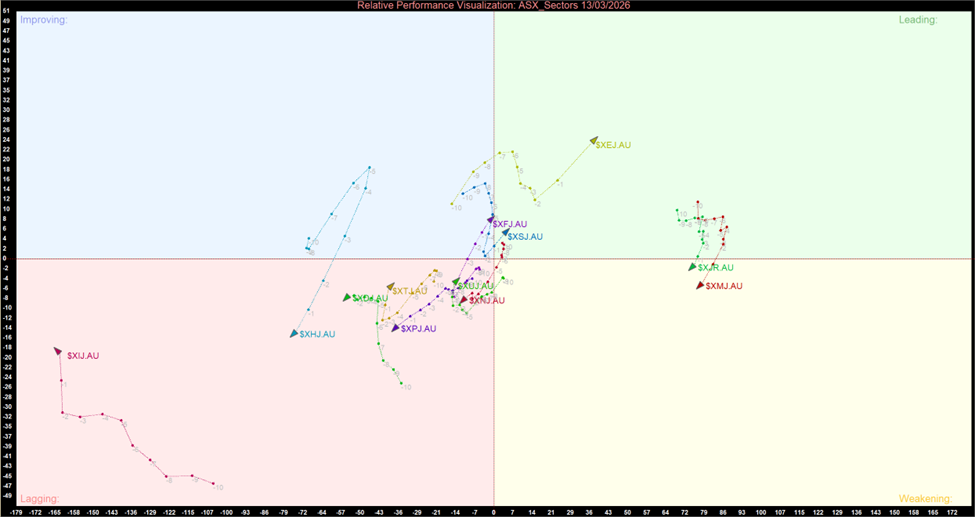
ASX Sector Weekly Momentum Chart (at the closing price of 13th March 2026). Powered by: amibroker.com
ASX Sector Weekly Momentum Summary Table
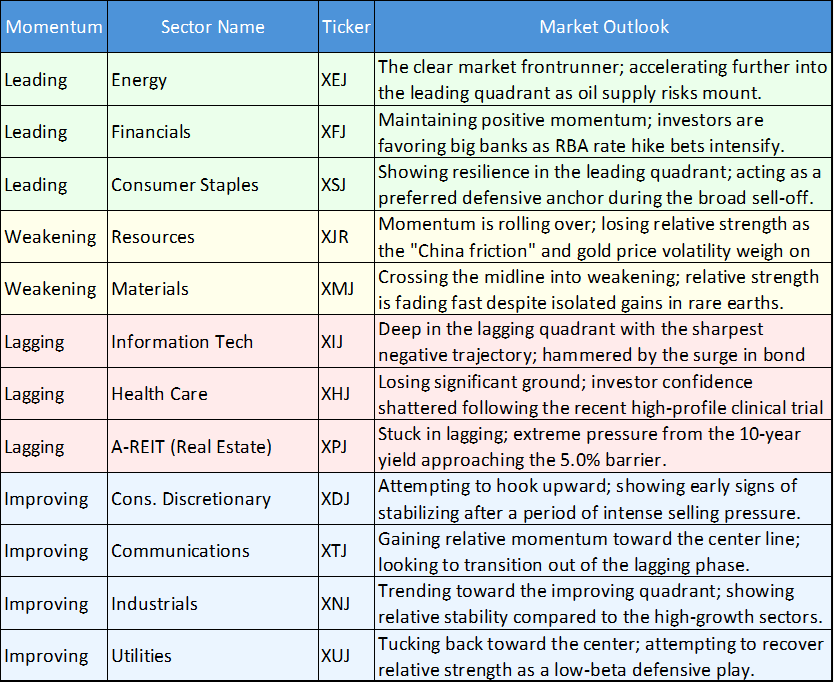
Leading Momemtum: The Dominant Leader - Energy (XEJ)
- The Energy sector is the standout performer, positioned far into the "Leading" quadrant with a strong upward trajectory. This indicates it isn't just outperforming the index, but its outperformance is actually accelerating. This is the primary destination for capital as oil prices breach $US100/bbl.
Enter Leading: The Defensive Pivot - Financials & Staples (XFJ, XSJ)
- Both Financials and Consumer Staples have crossed the vertical midline into the "Leading" quadrant.
- The "hook" upward in Financials suggests traders are aggressively pricing in the RBA rate hike benefits for bank margins.
- Staples are acting as a classic defensive anchor, gaining relative strength as the broader market volatility increases.
The Weakening Momentum: Resources & Materials (XJR, XMJ)
- While these sectors still have high relative strength (they are to the right of the center line), their momentum is pointing sharply downward. They have moved from "Leading" to "Weakening," signaling that the peak of the mining rally has passed for now, likely due to the China iron ore shipment bans and production downgrades.
Lagging Momentum: The "Tech Wreck" (XIJ)
- Information Technology is in the worst possible position on the chart. It is deep in the "Lagging" quadrant and continues to move further away from the center. This reflects a total lack of investor appetite for growth stocks as bond yields hit 4.96%.
Improving Momentum: Healthcare & Discretionary (XHJ, XDJ)
- Healthcare (XHJ) shows a massive "swing" from lagging toward the "Improving" quadrant. While still underperforming, its momentum is recovering, suggesting the selling pressure from the Immutep trial failure may be finding a floor.
- Consumer Discretionary (XDJ) is slowly curling upward, hinting at a potential "bottoming out" process despite the hawkish RBA backdrop.
Summary of Capital Flow
The chart shows a violent rotation: capital is exiting Growth (Tech) and exiting the peak of the Mining cycle (Resources) to seek shelter and yield in Energy, Banks, and Staples.

_03_16_2026_07_57_11_233658.jpg)


 Please wait processing your request...