
shevtsovy@shutterstock
Highlights
- Australian Strategic Materials shares rose nearly 19% on Tuesday.
- Despite the gains in ASM shares in May, the stock is down 79% in one year.
- ASM share price started to move upside after taking support from a horizontal trendline.
Australian Strategic Materials Limited (ASX: ASM) shares rallied on Tuesday, 16 May 2023, after the company announced that it had forged a partnership with Noveon Magnetics Inc. (Noveon), a US-based rare earth magnet manufacturer, for the sale of neodymium iron boron (NdFeB) alloy from the Korean Metals Plant (KMP). The stock was up 18.62% to trade at AUD 1.21 per share as of 1:35 PM, AEST on 16 May 2023 following this announcement.
As per the agreement, ASM will supply 100 tonnes of NdFeB alloy from the KMP to Noveon till 31 March 2024, as per a pre-decided schedule. The price for the supply of NdFeB alloy has been fixed by both parties based on the high-quality specification of the alloy. Both ASM and Noveon intend to develop a strategic partnership relating to long-term offtake for rare earth materials supporting magnet production, and they have agreed to use all reasonable endeavours to enter into a long-term supply and purchasing agreement.
Earlier this month, on 1 May 2023, the company announced that it signed a binding agreement with Vietnam Rare Earth Company (VTRE) to purchase rare earth oxides from Vietnam to be used as feedstock at ASM's Korean Metals Plant (KMP). As per this agreement, VTRE will supply 100 tonnes of product for the remainder of 2023. The pricing for the feedstock (in USD) will be determined using a formula-based mechanism referencing published market prices for neodymium-praseodymium oxide.
The company said this agreement helps ensure the feedstock needed to continue the ramp-up of production at KMP.
The above two agreements have helped ASM shares gain nearly 14% month-to-date and reduce their one-year losses to 79%. Will ASM shares continue their up move from hereon, and will be out of the long downtrend? Here's what ASM price chart and technical indicators suggest.
ASM’s Technical Analysis:
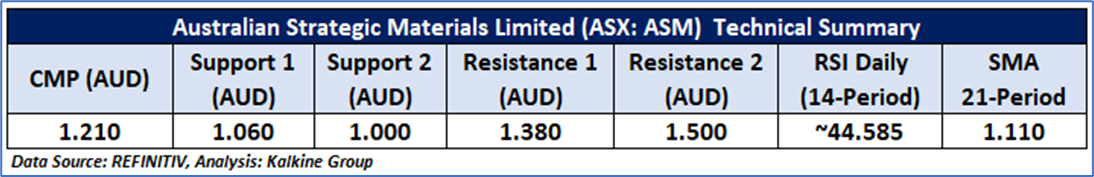
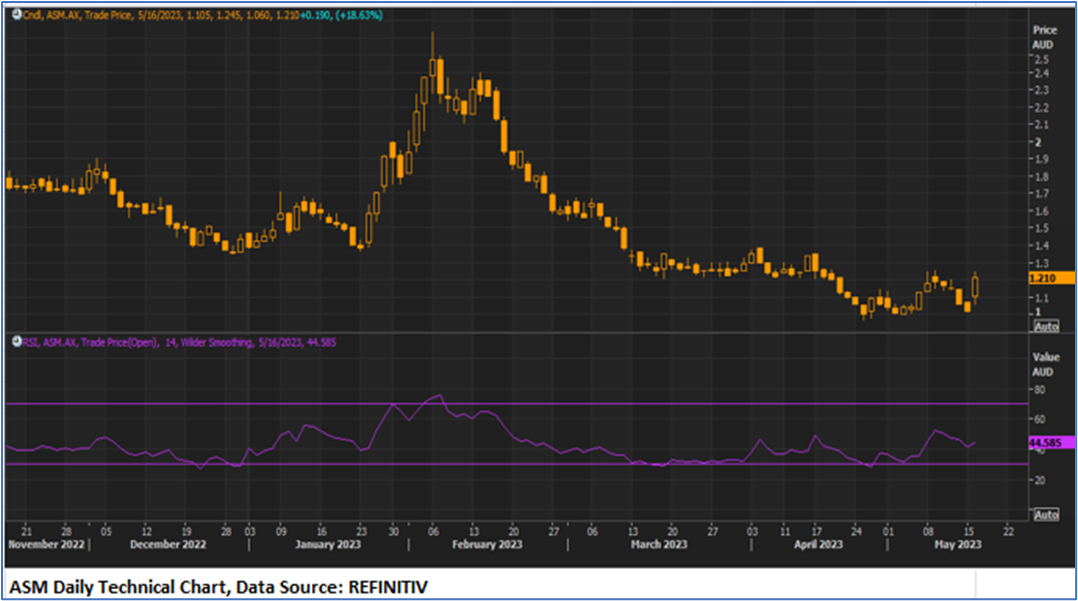
ASM share price started to move upside after taking support from a horizontal trendline. Moreover, RSI (14-period) is moving northward with a reading of 44.58, supporting a positive bias. However, prices are trading below the 21-period SMA, which may act as a resistance. Important support for the stock is positioned at AUD 1.06, while key resistance is placed at AUD 1.38.
Daily Technical Chart – ASM
The technical levels for the stock were evaluated as per the current market price of AUD 1.210 per share as on 16 May 2023 at 1:35 PM Sydney, Australia GMT+10.
Note 1: Past performance is neither an Indicator nor a guarantee of future performance.
Technical Indicators Defined:
Support: A level at which the stock prices tend to find support if they are falling, and a downtrend may take a pause backed by demand or buying interest. Support 1 refers to the nearby support level for the stock, and if the price breaches the level, then Support 2 may act as the crucial support level for the stock.
Resistance: A level at which the stock prices tend to find resistance when they are rising, and an uptrend may take a pause due to profit booking or selling interest. Resistance 1 refers to the nearby resistance level for the stock and if the price surpasses the level, then Resistance 2 may act as the crucial resistance level for the stock.
Stop-loss: It is a level to protect further losses in case of unfavourable movement in the stock prices.
The Green colour line reflects the 21-period moving average. SMA helps to identify existing price trends. If the prices are trading above the 21-period, prices are currently in a bullish trend (Vice – Versa).
The Blue colour line reflects the 50-period moving average. SMA helps to identify existing price trends. If the prices are trading above the 50-period, prices are currently in a bullish trend (Vice – Versa).
The Orange/ Yellow colour line represents the Trendline.
The Purple colour line in the chart's lower segment reflects the Relative Strength Index (14-Period), which indicates price momentum and signals momentum in trend. A reading of 70 or above suggests overbought status, while a reading of 30 or below suggests an oversold status.

_03_16_2026_07_57_11_233658.jpg)


 Please wait processing your request...