
Elena Elisseeva@shutterstock
Highlights
- Silex Systems Limited (ASX: SLX) shares have rallied over 1,400% in the last five years.
- Its revenue has jumped by over 300% from AUD 1 million in FY20 to AUD 4.39 million in FY22.
- The positive thing about Silex is that despite making losses, its long-term debt has not increased much.
Silex Systems Limited (ASX: SLX), which is mainly engaged in researching, developing, and commercialising its SILEX laser uranium enrichment technology, is a multibagger stock. Although in the short-term, the stock has witnessed some correction with nearly 21% fall in three months till Tuesday (23 May 2023), its one-year return is still more than 200% and over the last five years, SLX has delivered over 1400% return.
Silex's stock price performance has been underpinned by its revenue growth, although on the bottom-line basis, the company is yet to turn profitable. Its revenue has jumped by over 300% from AUD 1 million in FY20 to AUD 4.39 million in FY22. In the same time frame, its net loss after tax has grown from AUD 7.81 million in FY20 to AUD 9.46 million in FY22.
The positive thing about Silex is that despite increasing accumulated losses, its long-term debt has not increased much. Till the end of FY21, its long-term debt was nil. In FY22, the semiconductor company took a long-term debt of AUD 0.78 million. It has been funding its accumulated losses through fresh equity issuances.
Given its stock performance, this AUD 949 million market-cap stock became a part of the S&P/ASX 300 index effective from 20 March 2023. But given its past performance, is further upside left in SLX shares? Let's study the price chart of SLX to get an idea about its near-term trajectory.
SLX’s Technical Analysis:
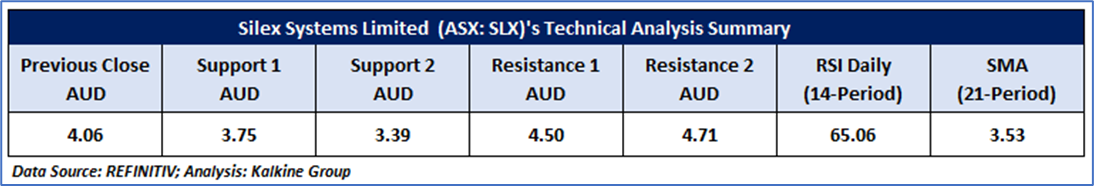
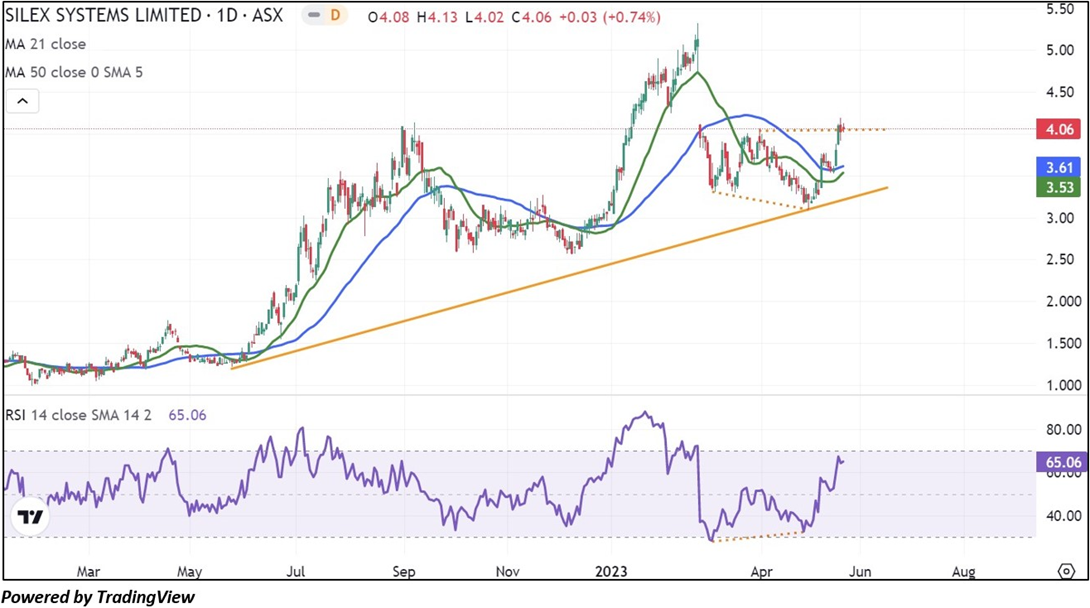
On the daily chart, SLX stock price is rebounding from a short-term upward-sloping trendline, indicating that the stock's uptrend is intact. In addition, after establishing a bottom divergence relative to the stock price from March to May 2023, the RSI (14-period) is moving north from the oversold region, further supporting a positive bias. Prices are trading above the 21-period and 50-period SMAs, which may act as the support levels for the stock; in contrast, the gap zone that appeared on 27 February 2023, may act as resistance. Important support for the stock is positioned at AUD 3.39, while key resistance is placed at AUD 4.50.
Daily Technical Chart – SLX
The technical levels for the stock were evaluated as per the closing price of AUD 4.06 per share, up ~0.74%, as on 23 May 2023.
Note 1: Past performance is neither an Indicator nor a guarantee of future performance.
Technical Indicators Defined:
Support: A level at which the stock prices tend to find support if they are falling, and a downtrend may take a pause backed by demand or buying interest. Support 1 refers to the nearby support level for the stock, and if the price breaches the level, then Support 2 may act as the crucial support level for the stock.
Resistance: A level at which the stock prices tend to find resistance when they are rising, and an uptrend may take a pause due to profit booking or selling interest. Resistance 1 refers to the nearby resistance level for the stock and if the price surpasses the level, then Resistance 2 may act as the crucial resistance level for the stock.
Stop-loss: It is a level to protect further losses in case of unfavourable movement in the stock prices.
The Green colour line reflects the 21-period moving average. SMA helps to identify existing price trends. If the prices are trading above the 21-period, prices are currently in a bullish trend (Vice – Versa).
The Blue colour line reflects the 50-period moving average. SMA helps to identify existing price trends. If the prices are trading above the 50-period, prices are currently in a bullish trend (Vice – Versa).
The Orange/ Yellow colour line represents the Trendline.
The Purple colour line in the chart's lower segment reflects the Relative Strength Index (14-Period), which indicates price momentum and signals momentum in trend. A reading of 70 or above suggests overbought status, while a reading of 30 or below suggests an oversold status.

_03_16_2026_07_57_11_233658.jpg)


 Please wait processing your request...