Gsign76@shutterstock
Highlights
- Greentech Metals Limited (ASX: GRE) shares saw a whopping rally of over 164% on Wednesday.
- With Wednesday's rally, GRE shares have narrowed their 1-year loss to nearly 10%.
- Will GRE shares extend Wednesday’s rally in the near future? Let’s study the price chart of GRE to get the answer.
After being in a long downtrend, Greentech Metals Limited (ASX: GRE) shares saw a whopping rally of over 164% on Wednesday, 3 May 2023. With Wednesday's rally, GRE shares have narrowed their 1-year loss to nearly 10%. Worth mentioning here is GRE shares have been falling since August 2022 and made a 52-week low of AUD 0.070 on Tuesday, 2 May 2023.
Wednesday's rally in the materials stock was triggered after the company announced assay and DHEM survey results from the follow-up drill program completed at the Austin prospect in February. Austin is part of the greater Whundo Cu-Zn project. As per the announcement, hole 23GTRC001 drilled at the Austin prospect revealed a copper-dominant mineralised horizon with significantly increased thickness and grades up to 5.4% Cu.
During the drilling programme, "elevated gold and cobalt were also intercepted," the company said. GRE further said the new assays indicate a threefold thickening of the Austin mineralised zone, which is consistent with Austin being a separate mineralising event to the overlying Whundo (East) resource. As per the company, these results are "extremely encouraging" given the significant results for both thickness and grade.
Given this development, will GRE shares extend Wednesday’s rally in the near future? Let’s study the price chart of GRE to get the answer.
GRE’s Technical Analysis:
GRE's price recently broke a downward-sloping trend line by an upside with the support of volumes, indicating the possibility of an upside movement from hereon. Furthermore, RSI (14-period) is moving northward with a reading of 74.93 and, the 21-period and 50-period SMAs are below the current market price, supporting a positive bias. Important support for the stock is positioned at AUD 0.150, while key resistance is placed at AUD 0.210.
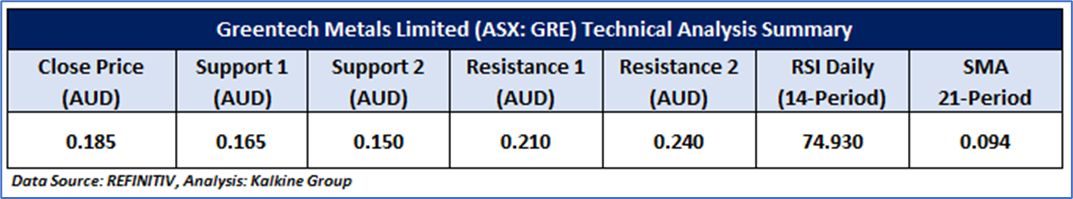
Daily Technical Chart – GRE
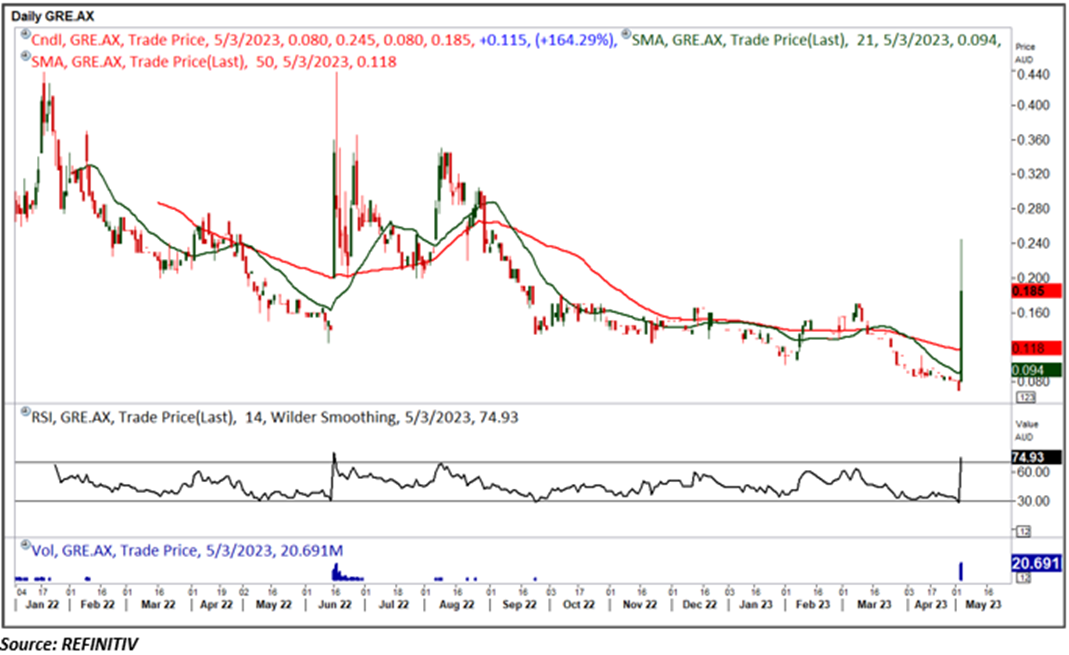
The technical levels for the stock were evaluated as per the closing price of AUD 0.185 per share as on 03 May 2023, up by ~164%.
Note 1: Past performance is neither an Indicator nor a guarantee of future performance.
Technical Indicators Defined:
Support: A level at which the stock prices tend to find support if they are falling, and a downtrend may take a pause backed by demand or buying interest. Support 1 refers to the nearby support level for the stock and if the price breaches the level, then Support 2 may act as the crucial support level for the stock.
Resistance: A level at which the stock prices tend to find resistance when they are rising, and an uptrend may take a pause due to profit booking or selling interest. Resistance 1 refers to the nearby resistance level for the stock and if the price surpasses the level, then Resistance 2 may act as the crucial resistance level for the stock.
Stop-loss: It is a level to protect further losses in case of unfavourable movement in the stock prices.
The Green colour line reflects the 21-period moving average. SMA helps to identify existing price trends. If the prices are trading above the 21-period, prices are currently in a bullish trend (Vice – Versa).
The Blue colour line reflects the 50-period moving average. SMA helps to identify existing price trends. If the prices are trading above the 50-period, prices are currently in a bullish trend (Vice – Versa).
The Orange/ Yellow colour line represents the Trendline.
The Purple colour line in the chart’s lower segment reflects the Relative Strength Index (14-Period), which indicates price momentum and signals momentum in trend. A reading of 70 or above suggests overbought status, while a reading of 30 or below suggests an oversold status.
Disclaimer:
This article (“Article”) has been prepared by Kalkine Pty Limited (ABN 34 154 808 312) (Australian financial services licence number 425376) (“Kalkine”) and its related bodies corporate who are authorised to provide general financial product advice. Kalkine.com.au and its associated pages are published by Kalkine.
Any information/advice provided in this article is general in nature and does not take into account your objectives, financial situation or needs. You should therefore consider whether the information is appropriate for your objectives, financial situation and needs before acting upon it.
There may be a Product Disclosure Statement, Information Memorandum or other offer document (“Offer Document”) for the securities or other financial products referred to in Kalkine articles. You should obtain a copy of the Offer Document and consider it before making any decision about whether to acquire the security or financial product.
Kalkine strongly recommends that you seek advice from a financial adviser, stockbroker or other professional (including taxation and legal advice) before acting on any advice/information in this Article or on the Kalkine website. Not all investments are appropriate for all people.
The information in this Article and on Kalkine website has been prepared from a wide variety of sources, which Kalkine, to the best of its knowledge and belief, considers accurate. Kalkine has made every effort to ensure the reliability of the information contained in its articles (including this Article), newsletters and websites. All information represents our views at the date of publication and may change without notice.
The information in this Article does not constitute an offer to sell securities or other financial products or a solicitation of an offer to buy securities or other financial products.
Kalkine does not issue, sell or deal in any financial products.
This Article may contain information on past performance of particular investments. Please note past performance is neither an indicator nor a guarantee of future performance.
To the extent permitted by law, and excluding any dishonesty or gross negligence by Kalkine, Kalkine disclaims and excludes all liability for any direct, indirect, implied, punitive, special, incidental or other consequential loss or damage arising from the use of or reliance on this Article, the Kalkine website and any information published on the Kalkine website without any warranties or representations by Kalkine to you. To the extent the law prohibits or limits this exclusion, Kalkine limits its liability to the resupply of services.
Please also read our Terms & Conditions and Financial Services Guide for further information.
Employees and/or associates of Kalkine and its related entities may hold interests in the securities or other financial products covered in this Article or on the Kalkine website. Any such employees and associates are required to comply with certain safeguards, procedures and disclosures as required by law.
Some of the images/music that may be used in the Article are copyright to their respective owner(s). Kalkine does not claim ownership of any of the pictures displayed/music used in the Article unless stated otherwise. The images/music that may be used in the Article are taken from various sources on the internet, including paid subscriptions or are believed to be in public domain. We have used reasonable efforts to accredit the source wherever it was indicated or was found to be necessary.
Kalkine Media Pty Ltd, an affiliate of Kalkine Pty Ltd, may have received, or be entitled to receive, financial consideration in connection with providing information about certain entity(s) covered on its website.
Copyright 2026 Krish Capital Pty. Ltd. (ABN 61629651510). All Rights Reserved. No part of this Article, or its content, may be reproduced in any form without our prior consent.

_03_16_2026_07_57_11_233658.jpg)


 Please wait processing your request...