
Proteomics International Laboratories Ltd (ASX:PIQ) is a medical technology company based in Australia. The company offers bio-analytical services and predictive diagnostics, specializing in proteomics—the study of protein structure and function. Their goal is to create and market diagnostic tools for long-term illnesses. PromarkerD, Diagnostics, and Analytical Services are the three business units that make up the company and are connected by a common technological platform.
Proteomics International Laboratories Ltd (ASX: PIQ) had an eventful March quarter. The company raised AUD 6.5mn through an institutional placement, expanding its global shareholder base and strengthening its balance sheet. Progress continued towards nationwide commercialisation of medical device PromarkerD in the US. Furthermore, its OxiDx technology secured a European patent across 19 major European countries for its innovative fingerprick blood test to measure oxidative stress. During the quarter, the company achieved AUD 173,000 in cash receipts from customers, contributing to a cash balance of AUD 9.04mn by the end of March 2024. Despite a 3.5% decline in revenues, net losses narrowed by 7% year-on-year in the first half ended on 31 December 2023.
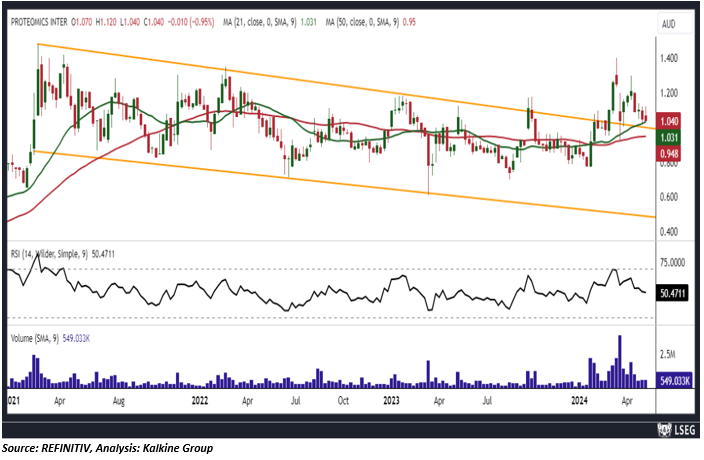
Technical View: On the weekly chart, it can be seen that the stock price of PIQ has broken out of a long-term falling wedge pattern that was formed during an uptrend in February 2021. This breakout has been supported by a surge in trading volume, suggesting a high chance of further upward movement. Moreover, there has been a significant increase in trading activity, which further strengthens the bullish outlook. Additionally, the stock is receiving strong support from the 14-period RSI (Relative Strength Index), a leading indicator that shows a reading of 50.47, indicating positive territory. Furthermore, PIQ's stock price is currently above both its 21-day and 50-day Simple Moving Averages (SMAs), which is a positive trend indicating a potential upcoming rally.
BlinkLab Limited (ASX:BB1) is an Australian firm that develops and markets smartphone-neurobehavioral tests to help diagnose ASD, ADHD, schizophrenia, and other neurodevelopmental disorders. As biomarkers for neurological and psychiatric illnesses, the company's tests include prepulse inhibition of acoustic startle (PPI), eyeblink conditioning (EBC), and habituation of eye blink response (BlinkLab Tests).
On 21 February 2024, BB1 filed a prospectus with ASIC to raise AU$7,000,000 by offering 35,000,000 shares at an issue price of AU$0.20 per share. During the half-year ended 31 December 2023, the Company didn’t generate any revenue and reported a loss per share of 0.27 cents, with a loss of AU$143,318. On 2 May 2024, it announced a collaboration with Turning Pointe Autism Foundation for clinical study in children with autism in the United States. The partnership plans to conduct an AI/ML algorithms and models based study on up to 200 children for a larger FDA registration, targeted towards the second half of 2024.
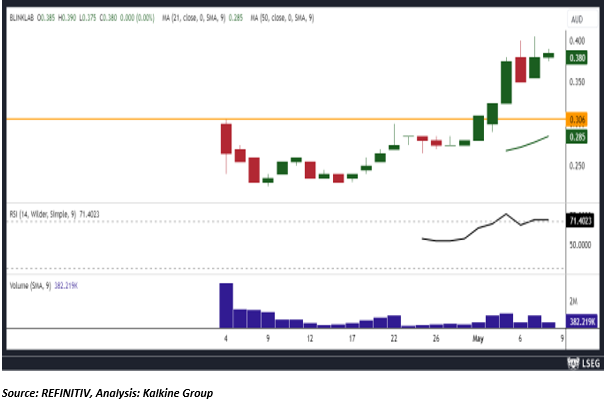
Technical View: On the daily chart, the prices of BB1 are currently above the horizontal trendline support zone and are being supported by it. Additionally, the momentum oscillator 14-period RSI (Relative Strength Index), is a leading indicator that shows a reading of 71.40, indicating positive territory. The prices are also trading above the trend-following indicator 21-period SMA, which could serve as a potential support zone. A significant support level for the stock is situated at AUD 0.330, while the primary resistance level is located at AUD 0.420.
Note 1: How to Read the Charts?
The Green colour line reflects the 21-period moving average while the red line indicates the 50-period moving average. SMA helps to identify existing price trends. If the prices are trading above the 21-period and 50-period moving average, then it shows prices are currently trading in a bullish trend.
The Black colour line in the chart’s lower segment reflects the Relative Strength Index (14-Period) which indicates price momentum and signals momentum in trend. A reading of 70 or above suggests overbought status while a reading of 30 or below suggests an oversold status.
The Blue colour bars in the chart’s lower segment show the volume of the stock. The volume is the number of shares that changed hands during a given day. Stocks with high volumes are more liquid than stocks with lesser volume and liquidity in stocks helps in easier and faster execution of the order.
The Orange colour lines are the trend lines drawn by connecting two or more price points and used for trend identification purposes. The trend line also acts as a line of support and resistance.
Technical Indicators Defined: -
Support: A level at which the stock prices tend to find support if they are falling, and a downtrend may take a pause backed by demand or buying interest.
Resistance: A level at which the stock prices tend to find resistance when they are rising, and an uptrend may take a pause due to profit booking or selling interest.

_03_16_2026_22_41_23_961043.jpg)

_03_16_2026_07_57_11_233658.jpg)


 Please wait processing your request...