
lp-studio@shutterstock
Highlights
- Month to date, LKE shares have appreciated over 21%.
- Last month on 27 April, LKE shares made a 52-week low of AUD 0.405.
- Will the recovery in LKE share continue? Let's study the price chart of LKE to know about its near-term price trend.
Lake Resources (ASX: LKE) snapped its three-day gaining streak to end 1.92% lower at AUD 0.510 per share on Tuesday, 9 May 2023. Despite today's losses, the stock is up 8.5% in a week. LKE and other ASX lithium miners witnessed some rebound in the last week following reports that China's EV sales and battery production are returning to the growth path, making a case for a revival in battery metal prices.
Despite the gains seen in LKE share price in the last one week, the stock is down nearly 65% in the last one year. Last month on 27 April, LKE shares made a 52-week low of AUD 0.405.
Worth mentioning here is that troubles for LKE began in June last year when the company announced the resignation of its CEO, Steve Promnitz. On 21 June 2022, Promnitz sold his 10.2 million shares in the company, few minutes before the stock's debut into the S&P/ASX 200 index. After this, US short seller J Capital published a report with a series of claims against the company, leading to a nearly 60% correction in LKE share price in just one week.
But Lake Resources shares witnessed recovery and went back to levels of AUD 1.595 on 11 August from AUD 0.61 per share seen on 14 July 2022, after the company responded to J Capital's claims, saying the report had incorrect information on technical matters and inaccurate assertions on Lake Resources’ progress. But the recovery was short-lived, and the stock went into a correction mode to hit a fresh 52-week low on 27 April 2023. Of late, LKE shares witnessed a minor pullback from their 52-week low level. Month till date, LKE shares have appreciated over 21%.
Will the recovery in LKE share continue? Let's study the price chart of LKE to know about its near-term price trend.
LKE’s Technical Analysis:
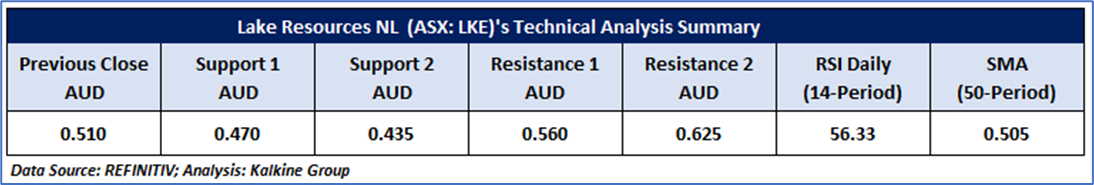
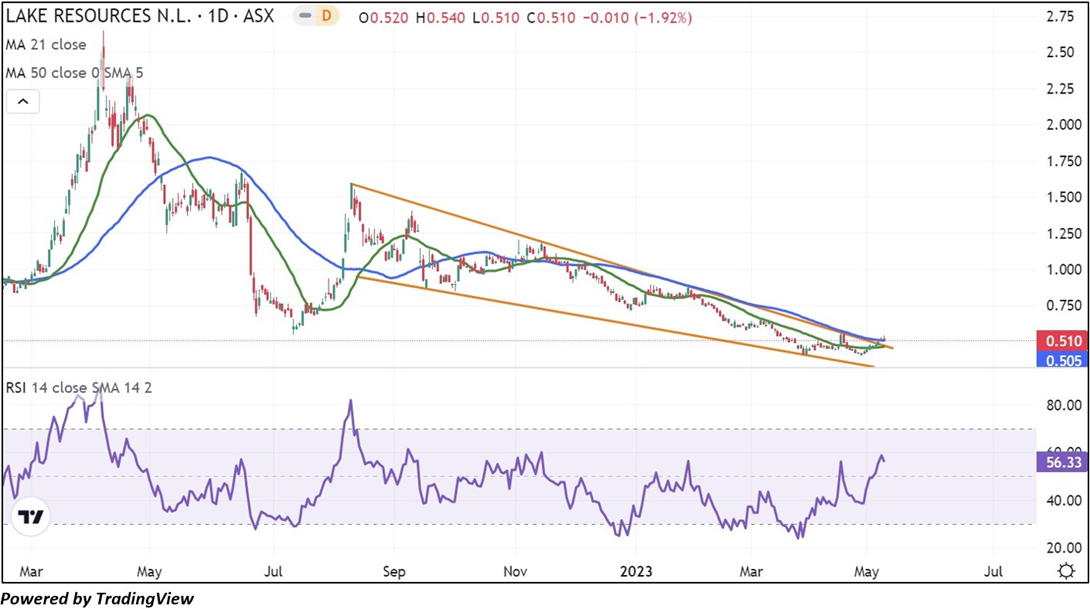
On the daily chart, LKE's stock price broke above both the upper boundary of a falling wedge pattern and the trend-following indicator 50-day SMA, indicating a positive bias. In addition, the RSI (14-period) is trending north from the midpoint, supporting an upside momentum. Prices are also trading above the 21-period SMA, which may act as a support level for the stock. Important support for the stock is located at AUD 0.435, while key resistance is positioned at AUD 0.560.
Daily Technical Chart – LKE
The technical levels for the stock were evaluated as per the closing market price of AUD 0.510 per share as of 9 May 2023.
Note 1: Past performance is neither an Indicator nor a guarantee of future performance.
Technical Indicators Defined:
Support: A level at which the stock prices tend to find support if they are falling, and a downtrend may take a pause backed by demand or buying interest. Support 1 refers to the nearby support level for the stock, and if the price breaches the level, then Support 2 may act as the crucial support level for the stock.
Resistance: A level at which the stock prices tend to find resistance when they are rising, and an uptrend may take a pause due to profit booking or selling interest. Resistance 1 refers to the nearby resistance level for the stock and if the price surpasses the level, then Resistance 2 may act as the crucial resistance level for the stock.
Stop-loss: It is a level to protect further losses in case of unfavourable movement in the stock prices.
The Green colour line reflects the 21-period moving average. SMA helps to identify existing price trends. If the prices are trading above the 21-period, prices are currently in a bullish trend (Vice – Versa).
The Blue colour line reflects the 50-period moving average. SMA helps to identify existing price trends. If the prices are trading above the 50-period, prices are currently in a bullish trend (Vice – Versa).
The Orange/ Yellow colour line represents the Trendline.
The Purple colour line in the chart's lower segment reflects the Relative Strength Index (14-Period), which indicates price momentum and signals momentum in trend. A reading of 70 or above suggests overbought status, while a reading of 30 or below suggests an oversold status.

_03_16_2026_07_57_11_233658.jpg)


 Please wait processing your request...